Viewing Reports
Overview
In our ongoing effort to improve user experience and provide greater flexibility in data analysis, Paramount Commerce has introduced new tables for all reports in the Merchant Portal. This enhancement will allow you to customize your reporting views and highlight the information that matters most to you.
Key Features
User-Friendly Interface
The updated tables are designed with an intuitive, clean interface making it easy for users to scan large amounts of data and customize their reports effortlessly.
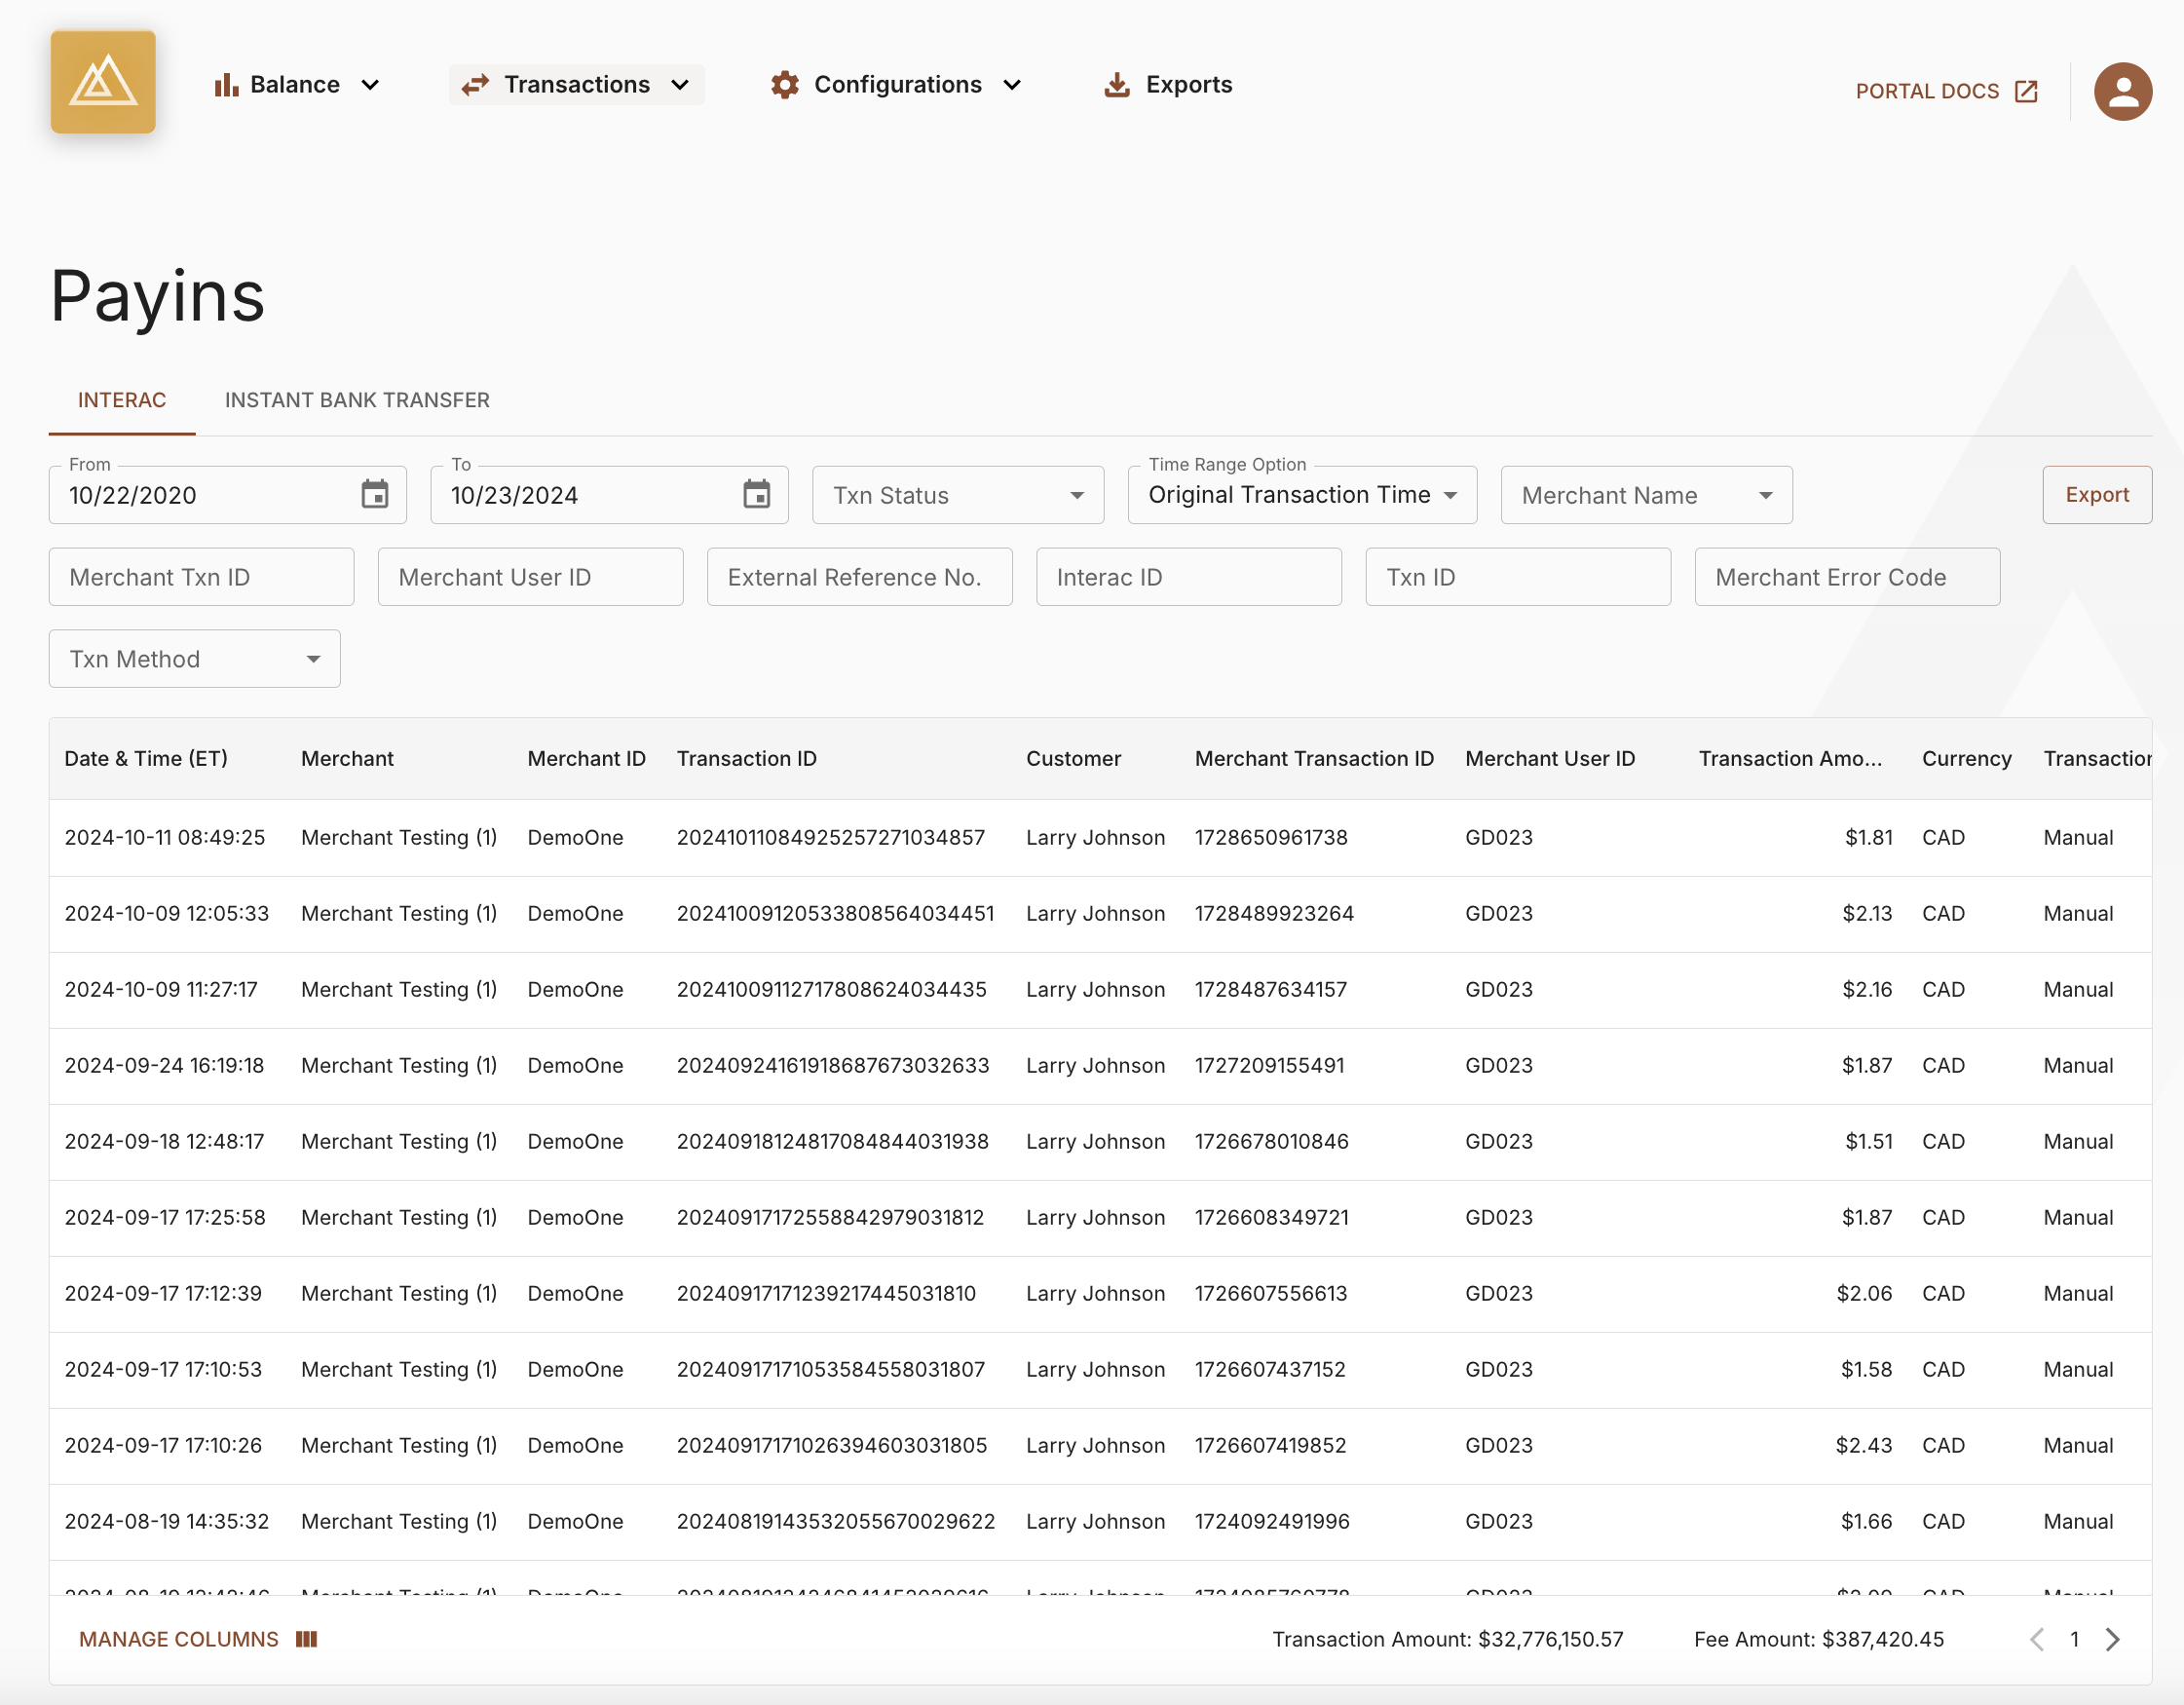
Payins Reporting Table
Column Customization
Users can now easily hide or show columns based on their preferences. This provides a more focused view, allowing you to highlight the most relevant data without unnecessary distractions.
- To access this functionality, click the "Manage Columns" button at the bottom of the table
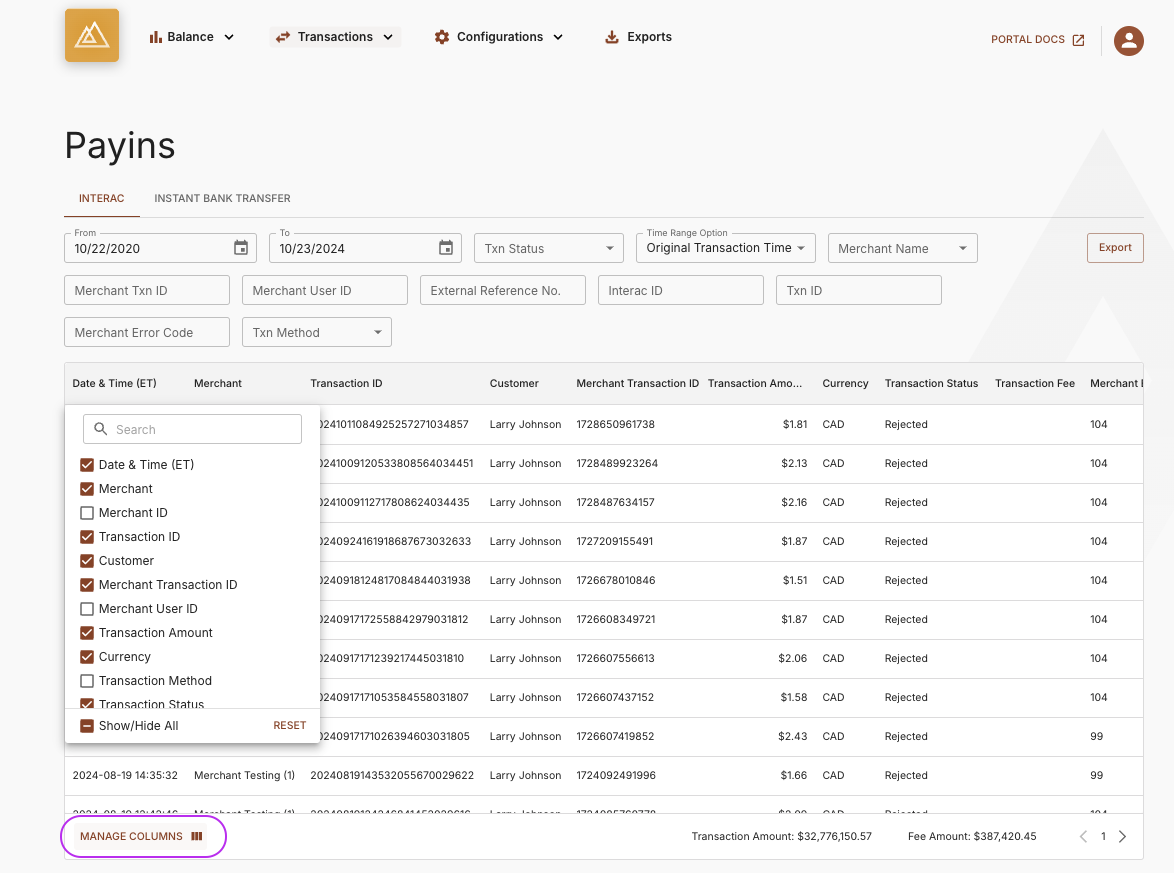
Manage Columns Functionality - Hide / Show Selected Columns
- You can also access this functionality by hovering over a column header and clicking the menu item. This will also allow you to hide the column directly
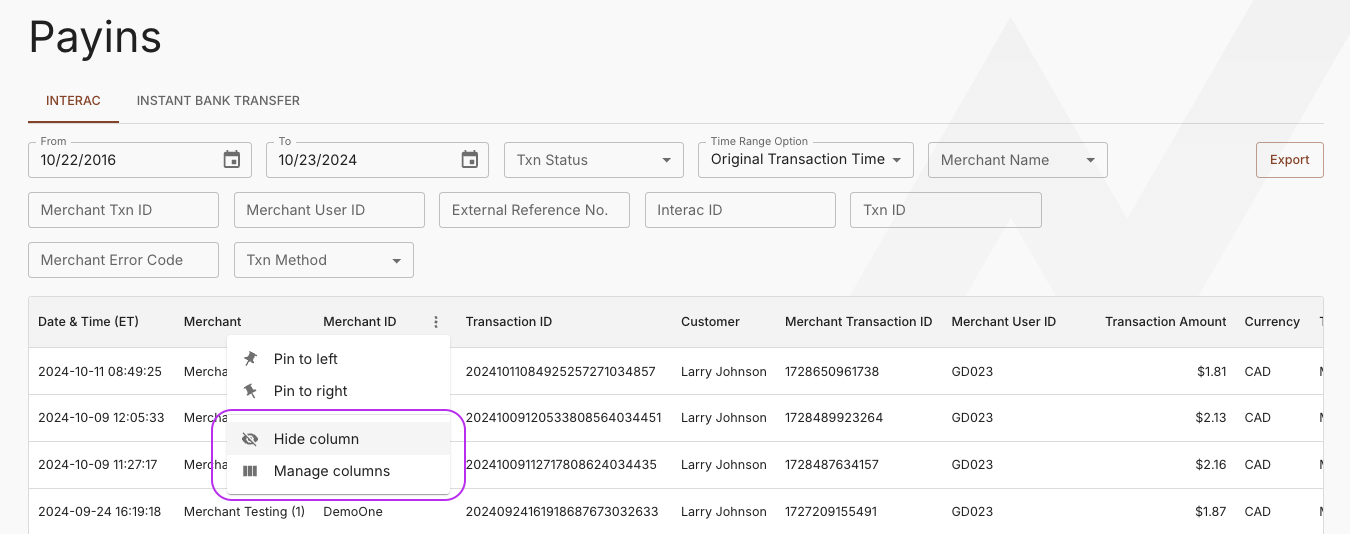
Hide a Column Using the Header Menu Item
Column Pinning
Users can pin columns to keep them visible while scrolling through extensive datasets. This feature enhances accessibility and ensures that key information is always in view.
- To access this functionality, hover over a column header and click the menu item. The menu item will give you the option to pin the column to the left or right of the table
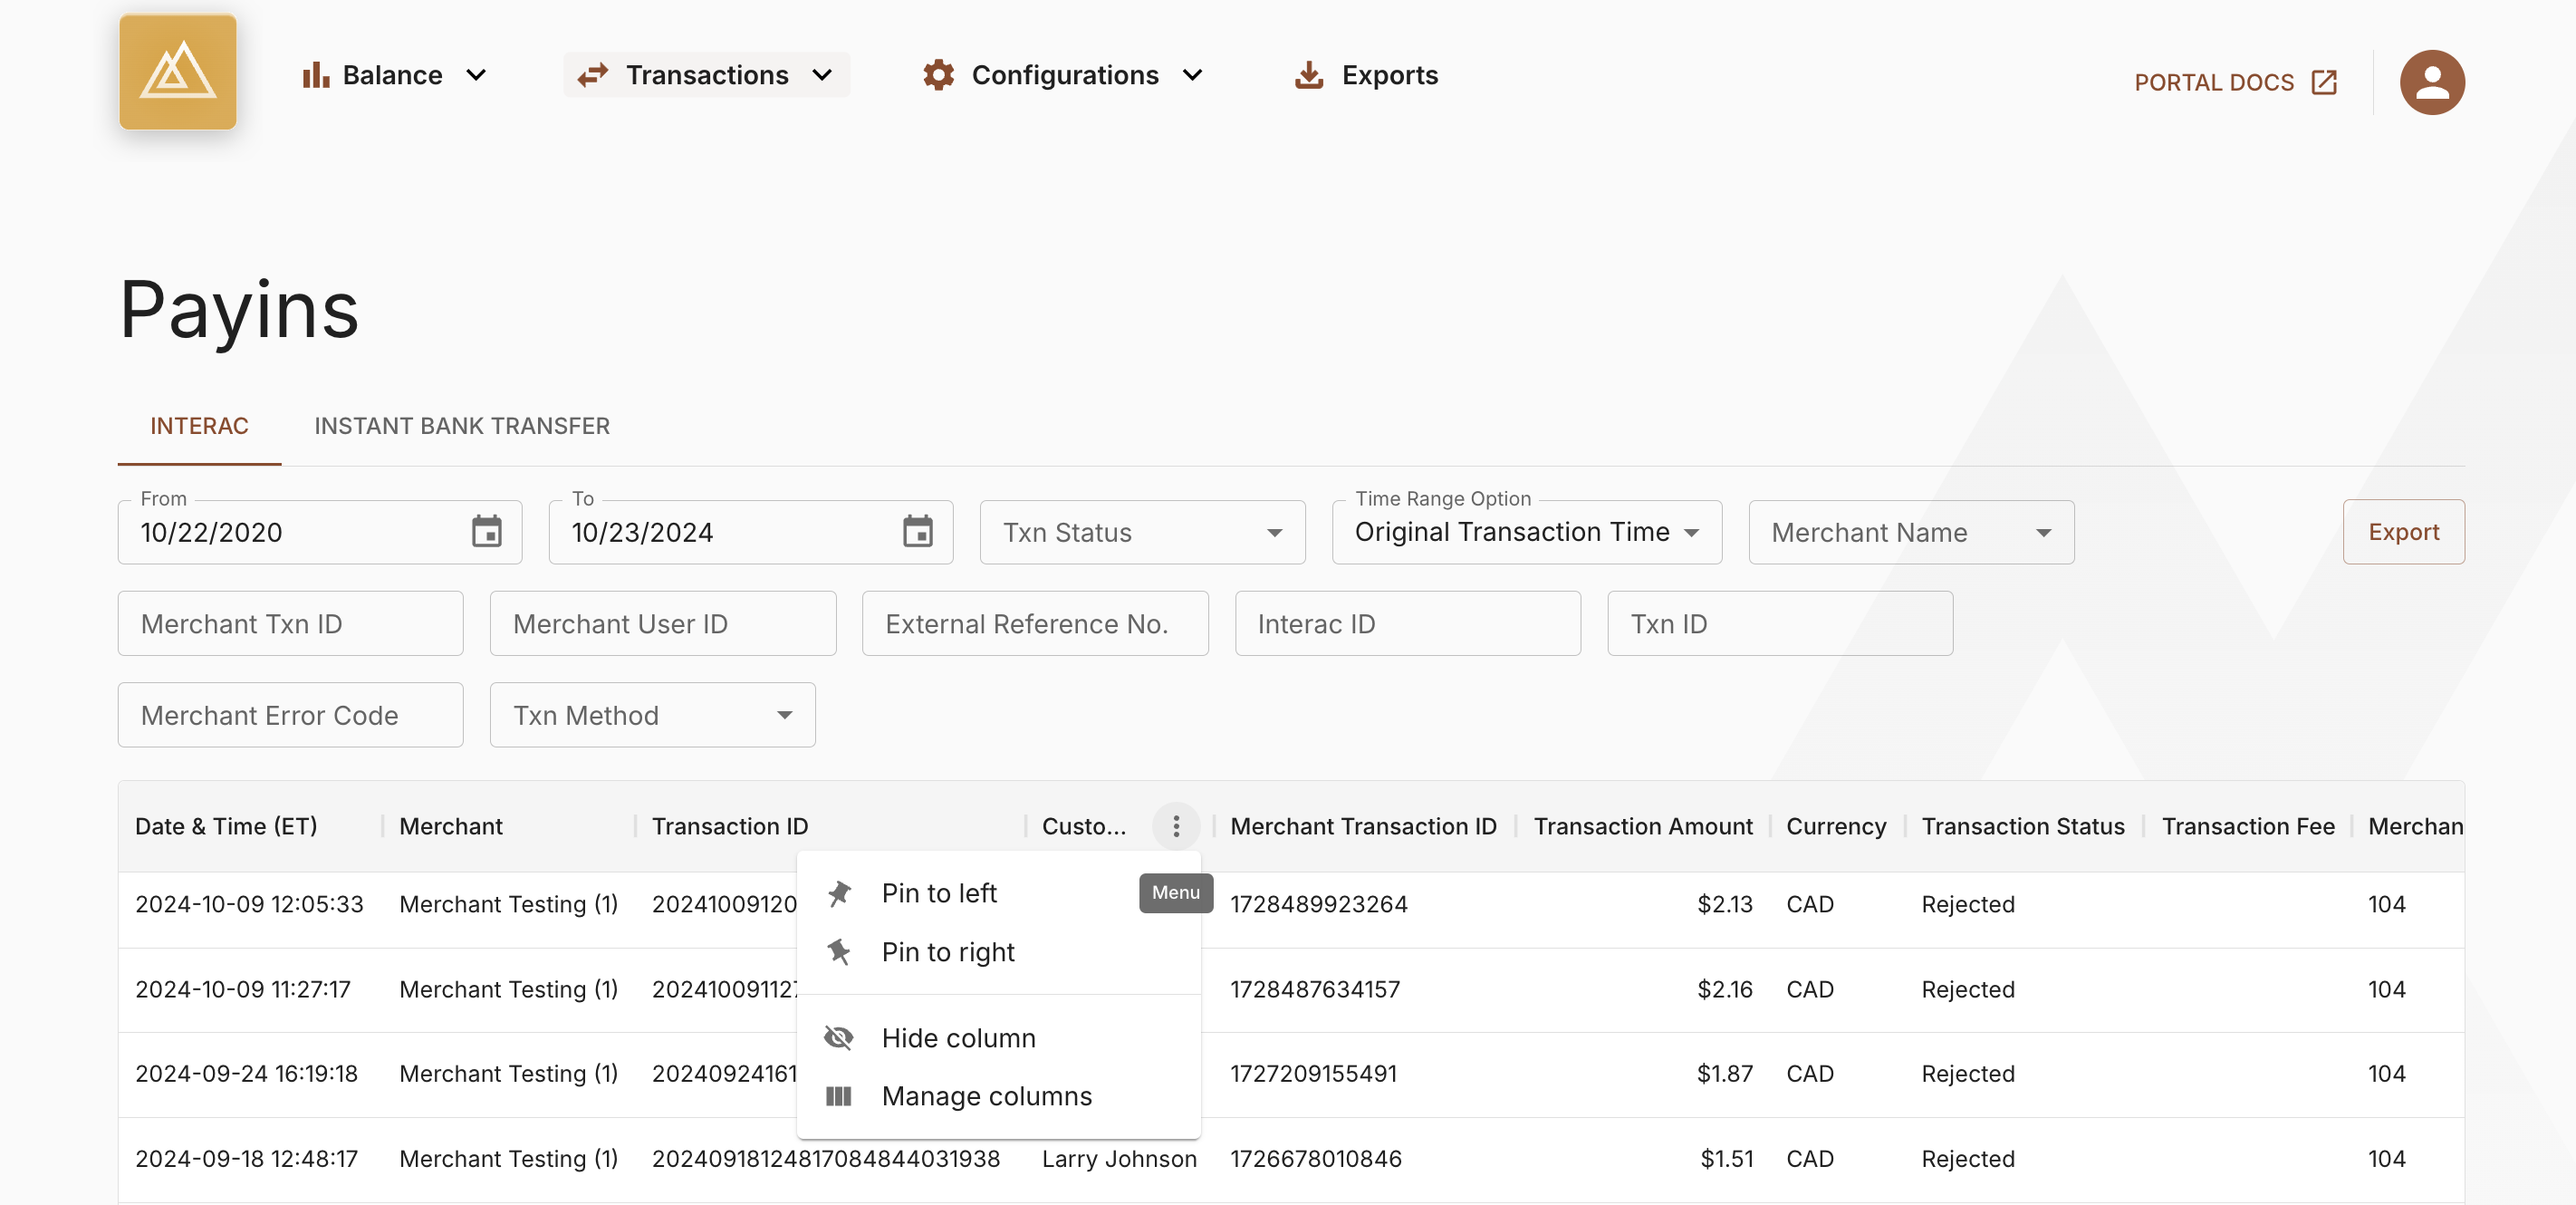
Pin Selected Columns Using the Header Menu Item
Move Columns
Users can click and drag column headers to reposition them within a table, allowing for personalized organization of the data they are viewing.
Click, Drag and Drop to Reposition Columns Within a Table
Frequently Asked Questions (FAQs)
For additional information not covered in this how-to guide, you can visit the Navigating Reports FAQs page.