Homepage and Analytics Dashboard
Overview
The merchant portal homepage features a fresh, modern design and an Analytics Dashboard exclusively for the INTERAC product. Merchants can gain valuable insights into their transaction volumes and conversion rates using interactive charts and summary cards, with flexible filter options to customize data views by reporting period and frequency. This feature gives you the ability to monitor and analyze your account balances and transactional data directly within the merchant portal, and empowers you to make more informed, data-driven decisions.
The homepage is comprised of two main sections: Balances and Analytics. Info for account balances and analytics is viewable by Merchant ID and corresponding product(s). At this time, analytics are only available to merchants integrated with INTERAC.

Global Merchant ID and Product Pickers
Balances
The Balances section of the homepage provides merchants with a snapshot of their pending payins, available funds, total balance, the day's payouts, reserves (if applicable), and TBR reserves (if applicable).
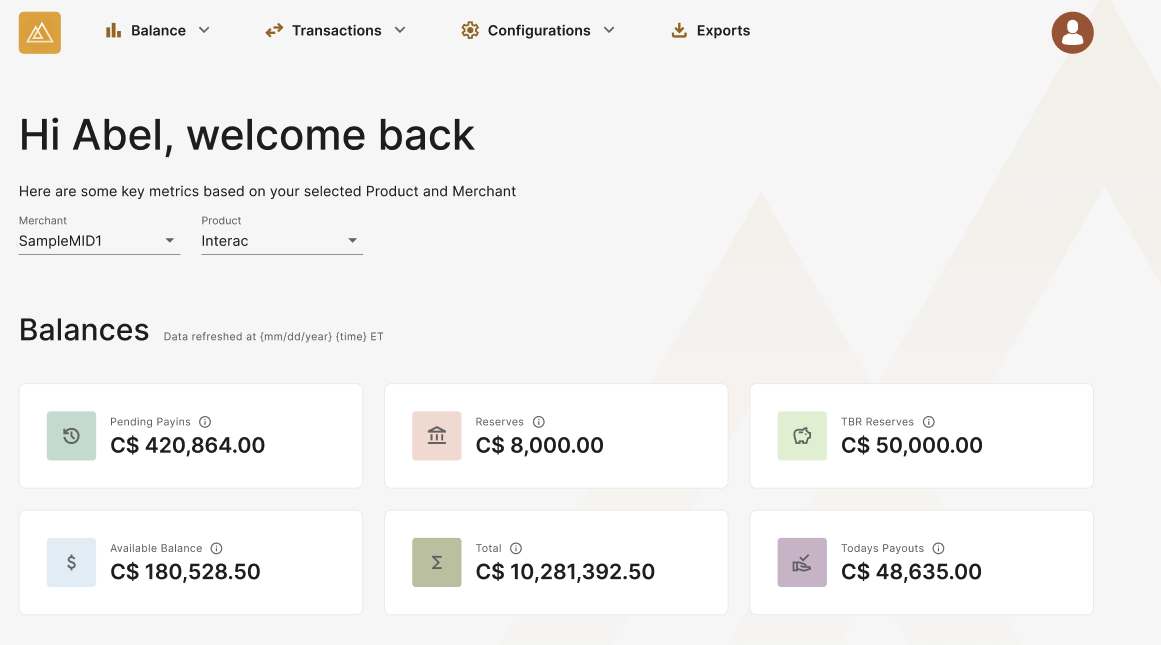
Homepage Balances
For each data point, merchants can hover over the info icon in the balance tile to view the following details:
| Data Point | Description | How is it Calculated? |
|---|---|---|
| Pending Payins | A merchant's balance of customer deposits waiting to be cleared after applicable fees have been deducted. As deposit EFTs are cleared, the funds will be transferred to a merchant's Available Balance. | N/A |
| Reserves | A percentage of customer deposits that are held in reserve for a set time period (as defined in a merchant's agreement with Paramount Commerce). Once the period ends, these funds will be transferred to the merchant's Available Balance.
| (total amount of accumulated payins since last reimbursement) x n design and an **A |
| TBR Reserves | To-be-released reserves are the total amount of a merchant's Reserves balance that has surpassed its holding period and is now available for release.
| the sum of non-released matured reserves from previous reimbursements |
| Available Balance | Represents a merchant's starting balance which is available to fund customer withdrawals / payouts, applicable chargebacks, returns and their associated fees (if applicable), since your last reimbursement. | (starting balance) + (accumulated payins - transaction fees) + (adjustments) + (TBR Reserves, if applicable) - (payouts + transaction fees) |
| Total | The sum of a merchant's Available Balance and Reserves balance (if applicable), since the merchant's last reimbursement. | (available balance) + (reserves, if applicable) |
| Today's Payouts | The total amount of a merchant's customer withdrawals - both pending and successful - processed from 12AM ET today up to the current time. This value resets daily. | N/A |
Analytics Dashboard
Currently, the Analytics Dashboard is only available to merchants using INTERAC and can be viewable by users with Admin and Operations level permissions.
The Analytics section provides merchants with key insights into their transaction volumes and payins conversion rates using dynamic summary cards and interactive charts. You can also view how your payins conversion rates compare to similar merchants, along with your approval rates and the most common reasons deposits are rejected.
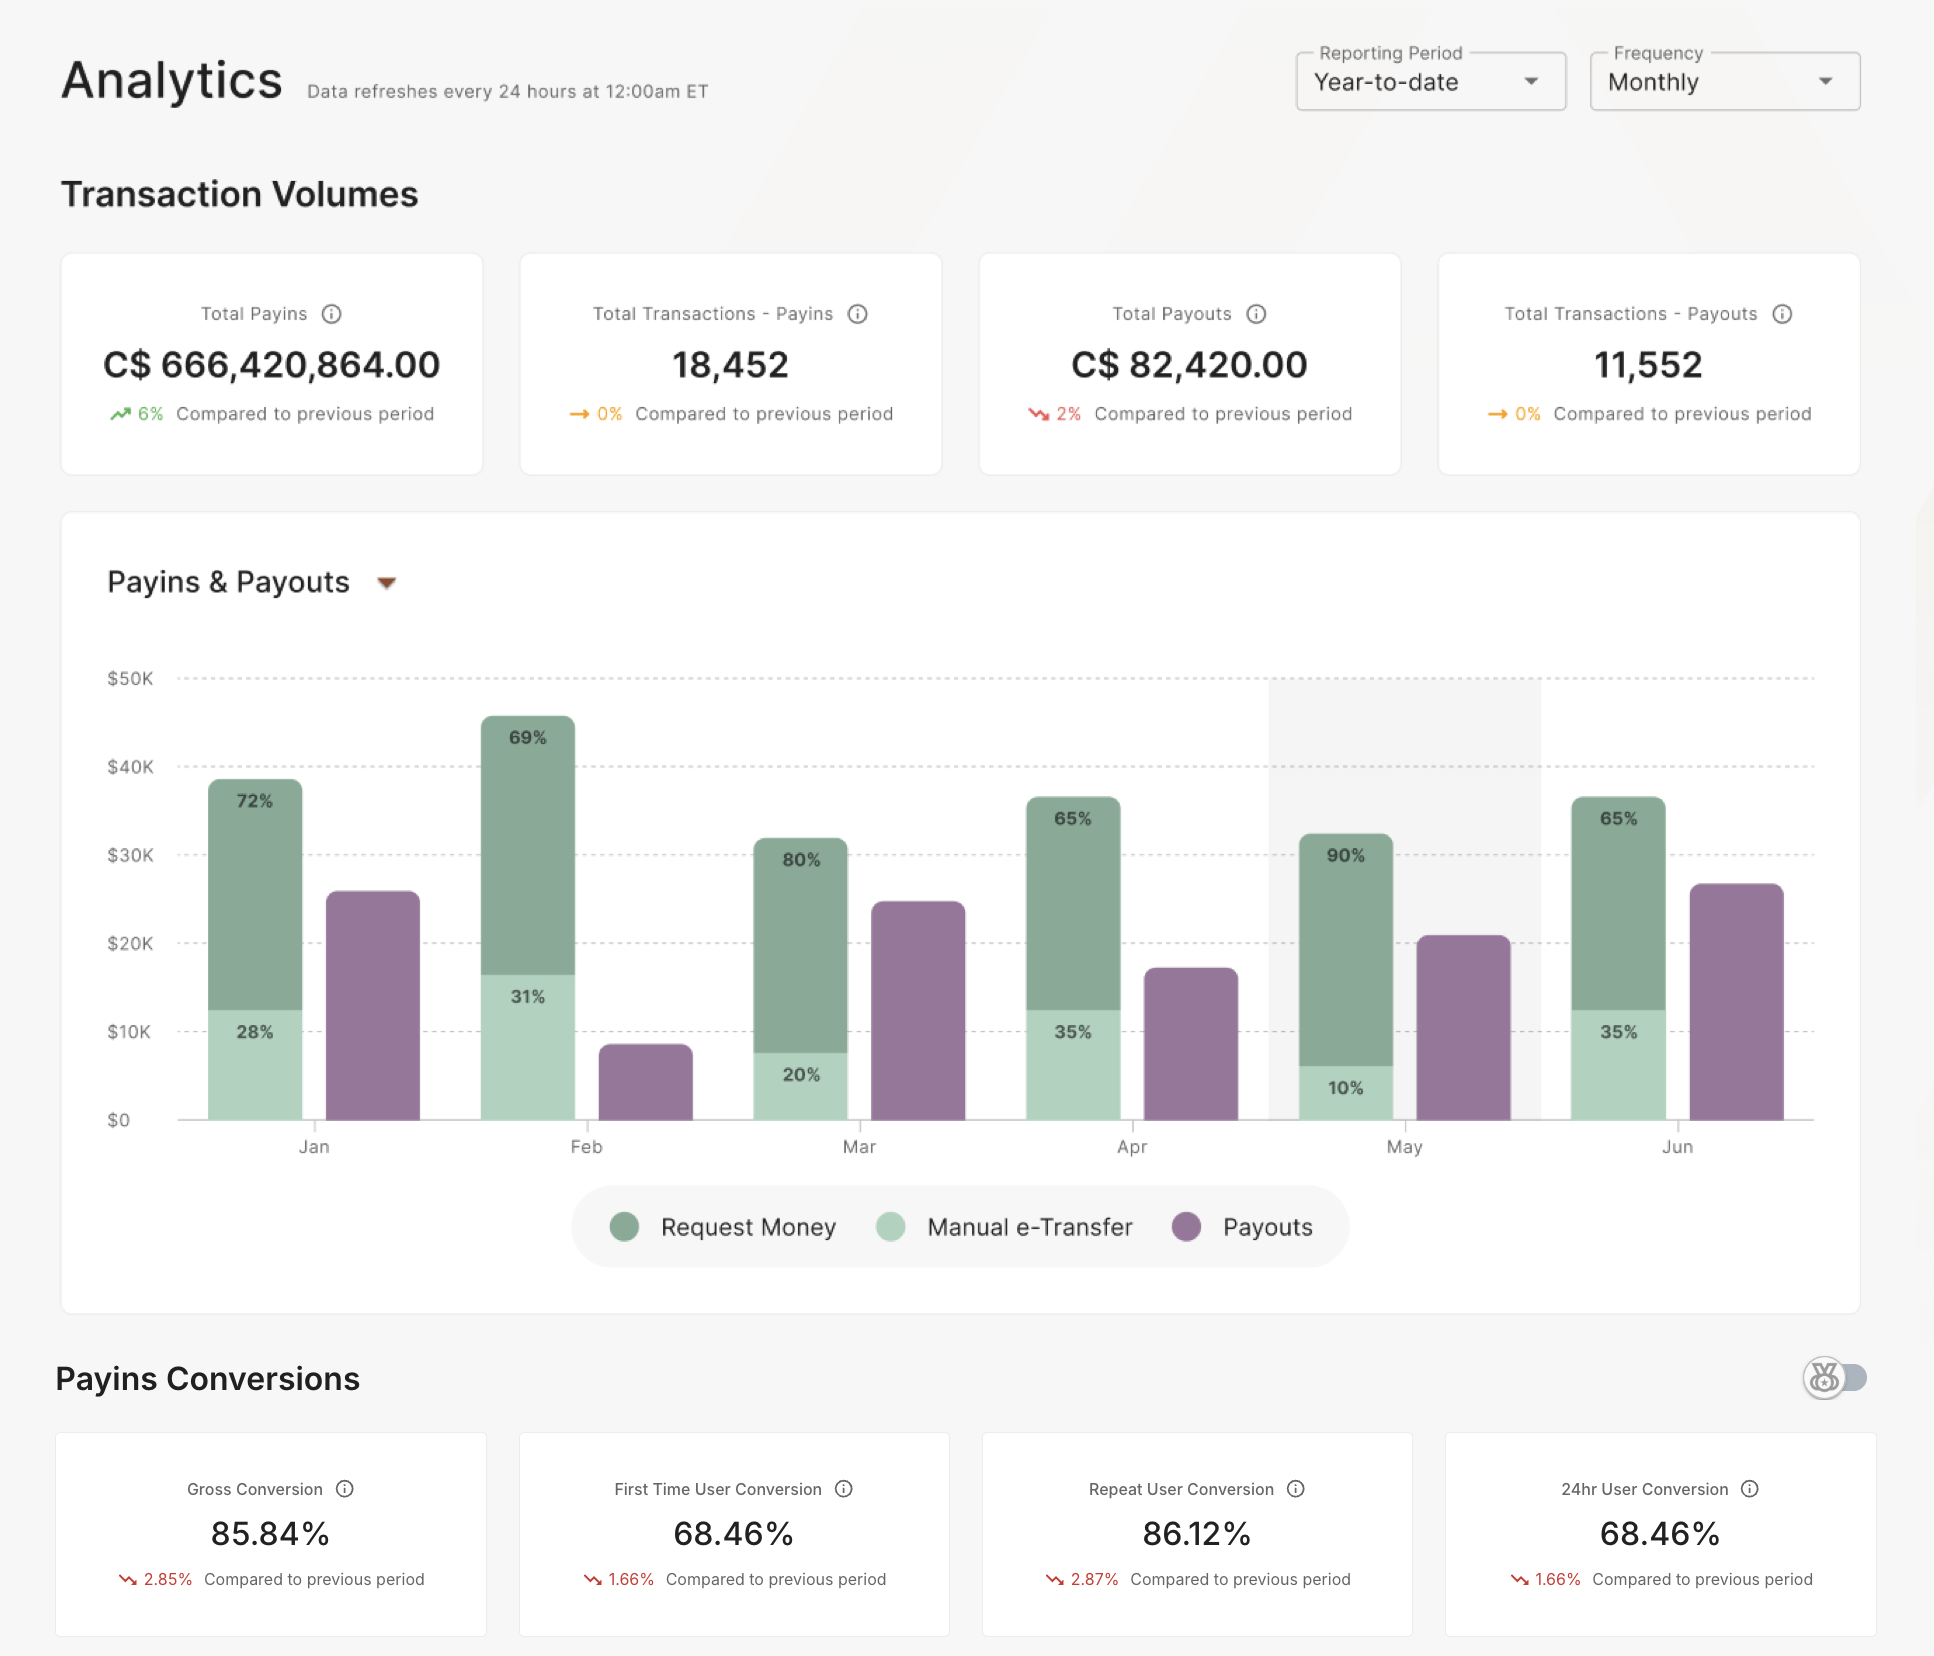
Homepage Analytics Dashboard
Customize Data Views With Flexible Reporting Periods & Frequencies
Users can customize the data displayed in the Transaction Volumes and Payins Conversion summary cards and charts using the following Reporting Period options:
| Reporting Period | What Date Range of Data is Displayed? |
|---|---|
| Last 7 Days | Data from the last 7 days, excluding today |
| Last Week | Data from the previous full week (Mon-Sun) |
| This Month | Data from the current month up to the current date, excluding today |
| Last Month | Data from the previous full month |
| This Quarter | Data from the current quarter up to the current date, excluding today |
| Last Quarter | Data from the previous full quarter |
| Past 6 Months | Data from the past 6 months up to the current date, excluding today |
| Last Year | Data from Jan 1st to Dec 31st of the previous year |
| Year to Date | Data from the current year up to the current date, excluding today |
You can analyze your data at a high level with monthly or weekly frequencies to identify trends and patterns, or dive deeper with daily views to assess performance during major events / campaign launches.
View Transaction Volumes
Data for transaction volumes is presented using 1) summary cards that highlight key metrics and 2) a dynamic chart that allows you to visualize trends and patterns over time.
Transaction Volumes Summary Cards
Transaction summary cards provide a quick overview of your total amount of customer deposits, total number of deposit transactions, total amount of customer withdrawals and total number of withdrawal transactions, based on your selected Reporting Period.
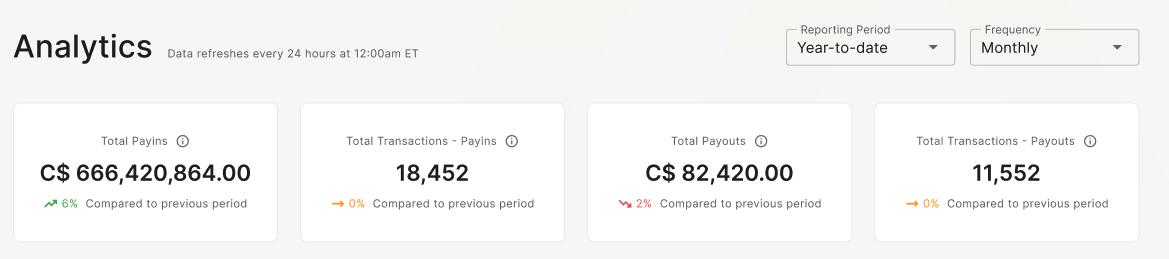
Transaction Volume Summary Cards
These cards also show the % change in volume compared to the previous period.
Based on your selected reporting period, the following outlines the corresponding date range that defines the previous period:
| Reporting Period Selected | Previous Period Date Range |
|---|---|
| Last 7 Days | Previous 7 days |
| Last Week | Previous full week |
| This Month | Previous month, using the same date range For eg, if today is Dec 18th, then the current reporting period would take into account data from Dec 1st - 17th and the comparison would be run against data from Nov 1st - 17th |
| Last Month | Previous full month before last |
| This Quarter | Previous quarter, using the same date range For eg, if today is Dec 18th, then the current reporting period would take into account data from Oct 1st - Dec 17th and the comparison would be run against data from Sept 1st - Nov 17th |
| Last Quarter | Previous full quarter before last |
| Past 6 Months | Previous 6 months before past 6 months, using the same date range For eg. if today is Dec 18th, then the current reporting period would take into account data from Jul 1st - Dec 17th and the comparison would be run against data from Jan 1st - Jun 17th |
| Last Year | Previous full year before last |
| Year to Date | Previous year YTD, using the same date range For eg. if today is Dec 18th, then the current reporting period would take into account data from Jan 1st - Dec 17th 2024 and the comparison would be run against data from Jan 1st - Dec 17th 2023 |
Transaction Volumes Chart
The transaction volumes chart provides merchants with a dynamic and interactive visual overview of their payins and payouts activity over time, highlighting the split between Request Money and manual e-Transfer transaction deposits. It enables a side-by-side comparison of payins and payouts volumes, or allows you to focus solely on either payins or payouts volumes for a more targeted analysis.
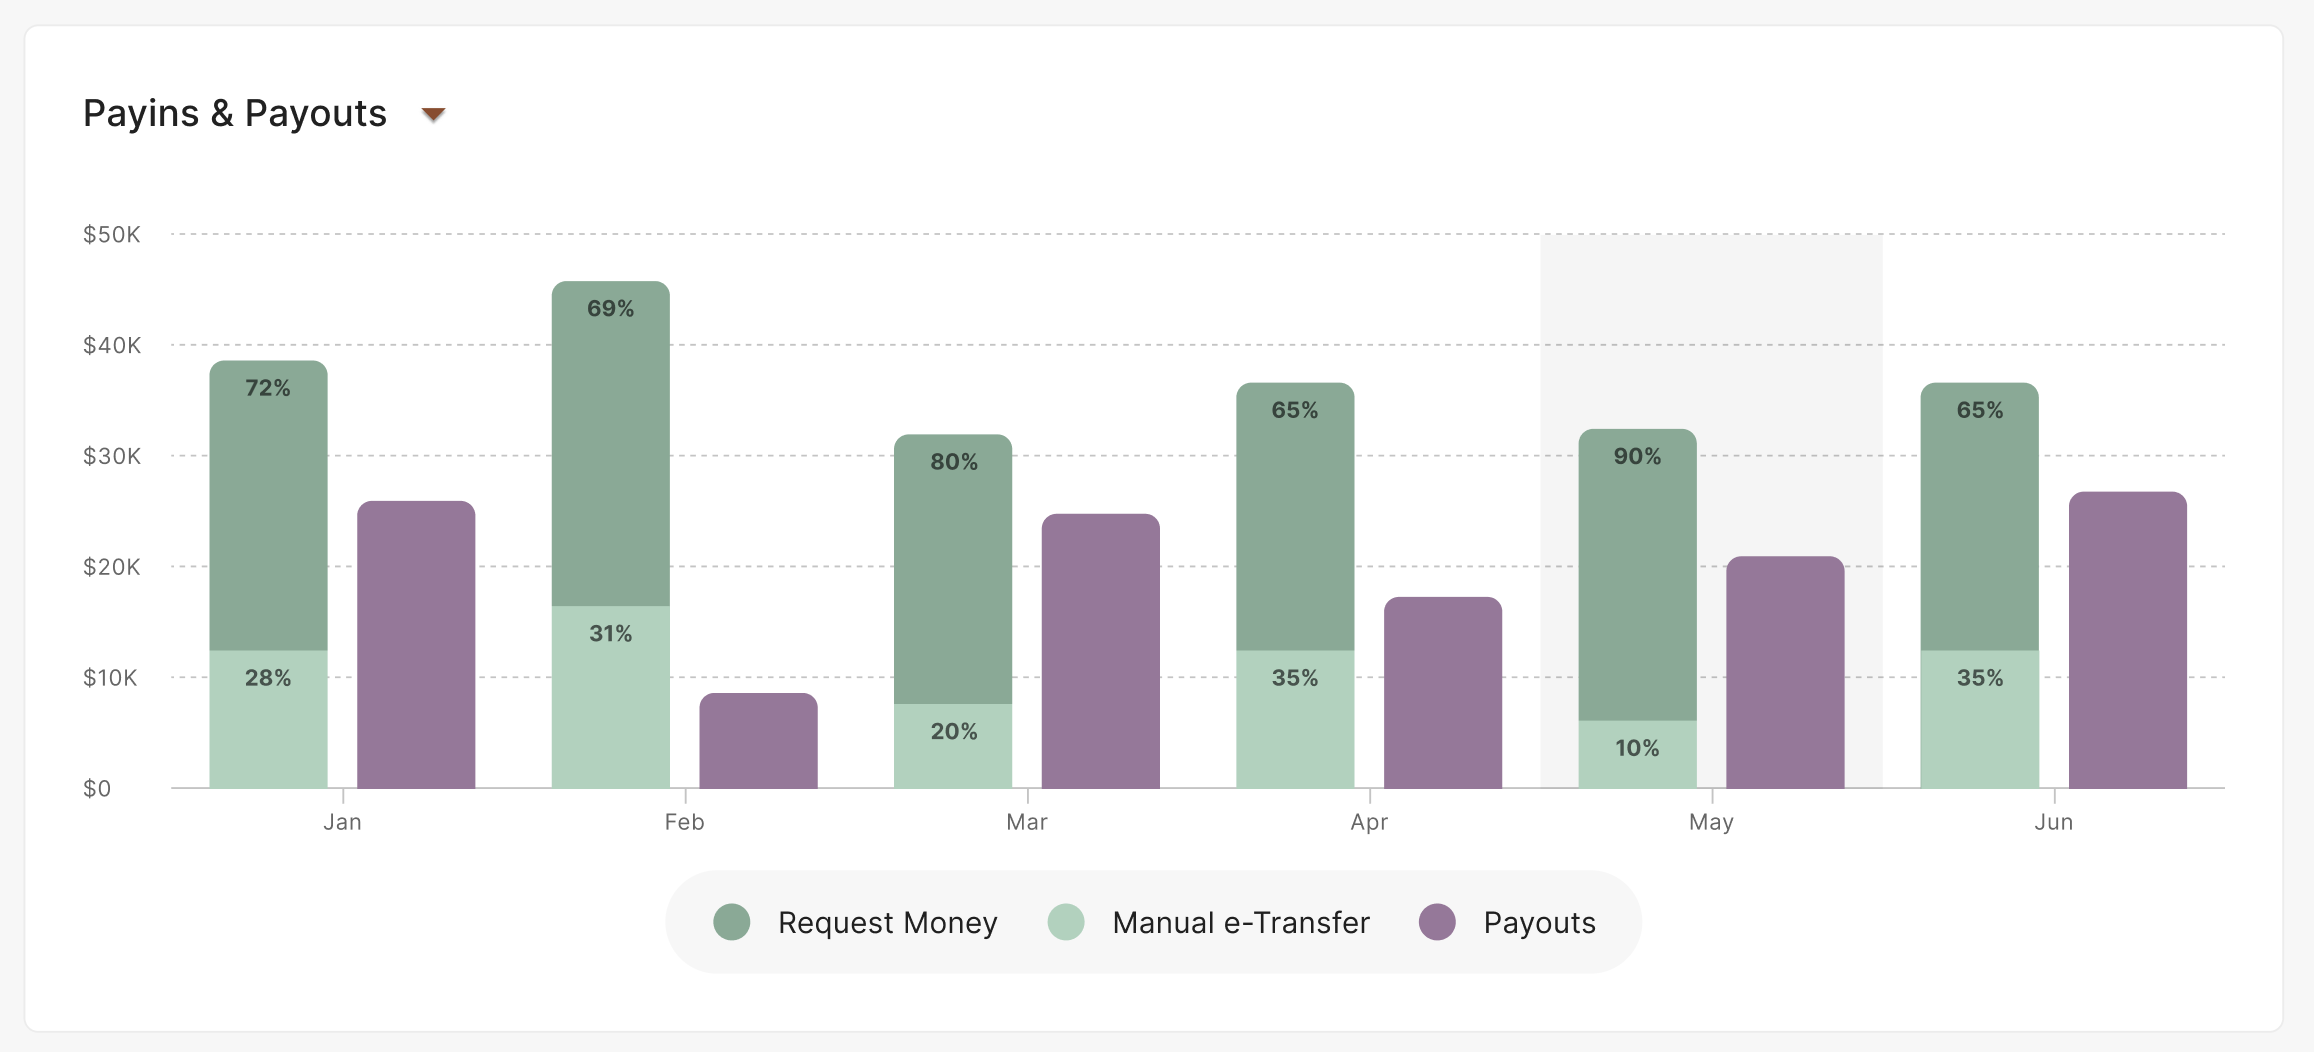
Transaction Volumes Chart
You can hover over a specific time period to see detailed information about the total amount of payins / payouts, the number of transactions and the average transaction value (ATV).
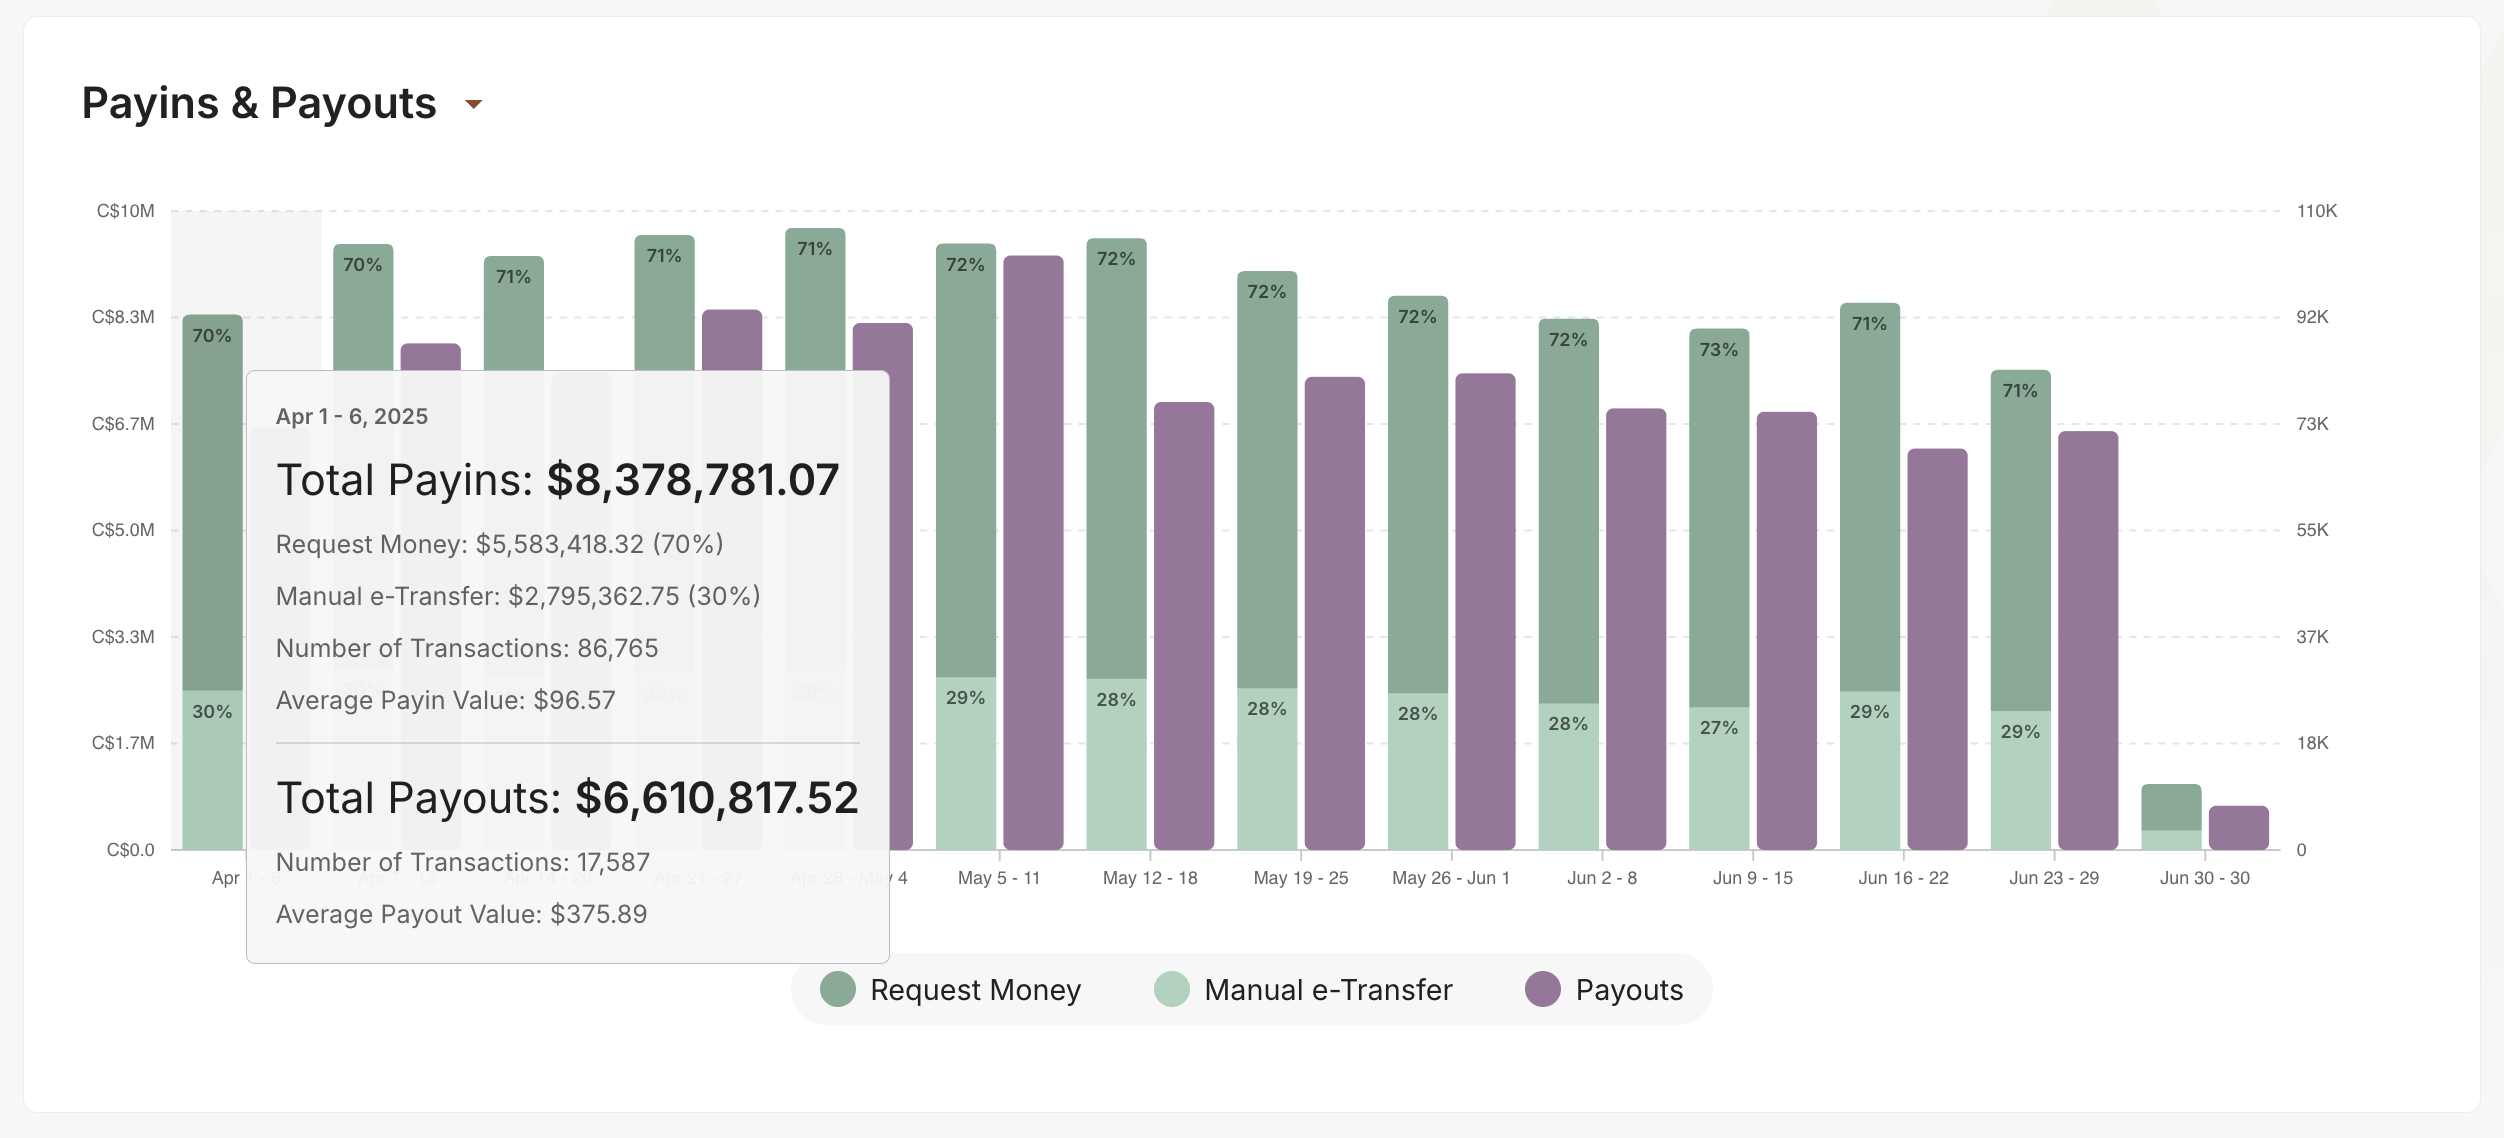
Transaction Volumes Detailed View
When viewing data exclusively for payins or payouts, merchants can enable the "Previous Year Comparison" toggle to compare the current year's data with the previous year's.
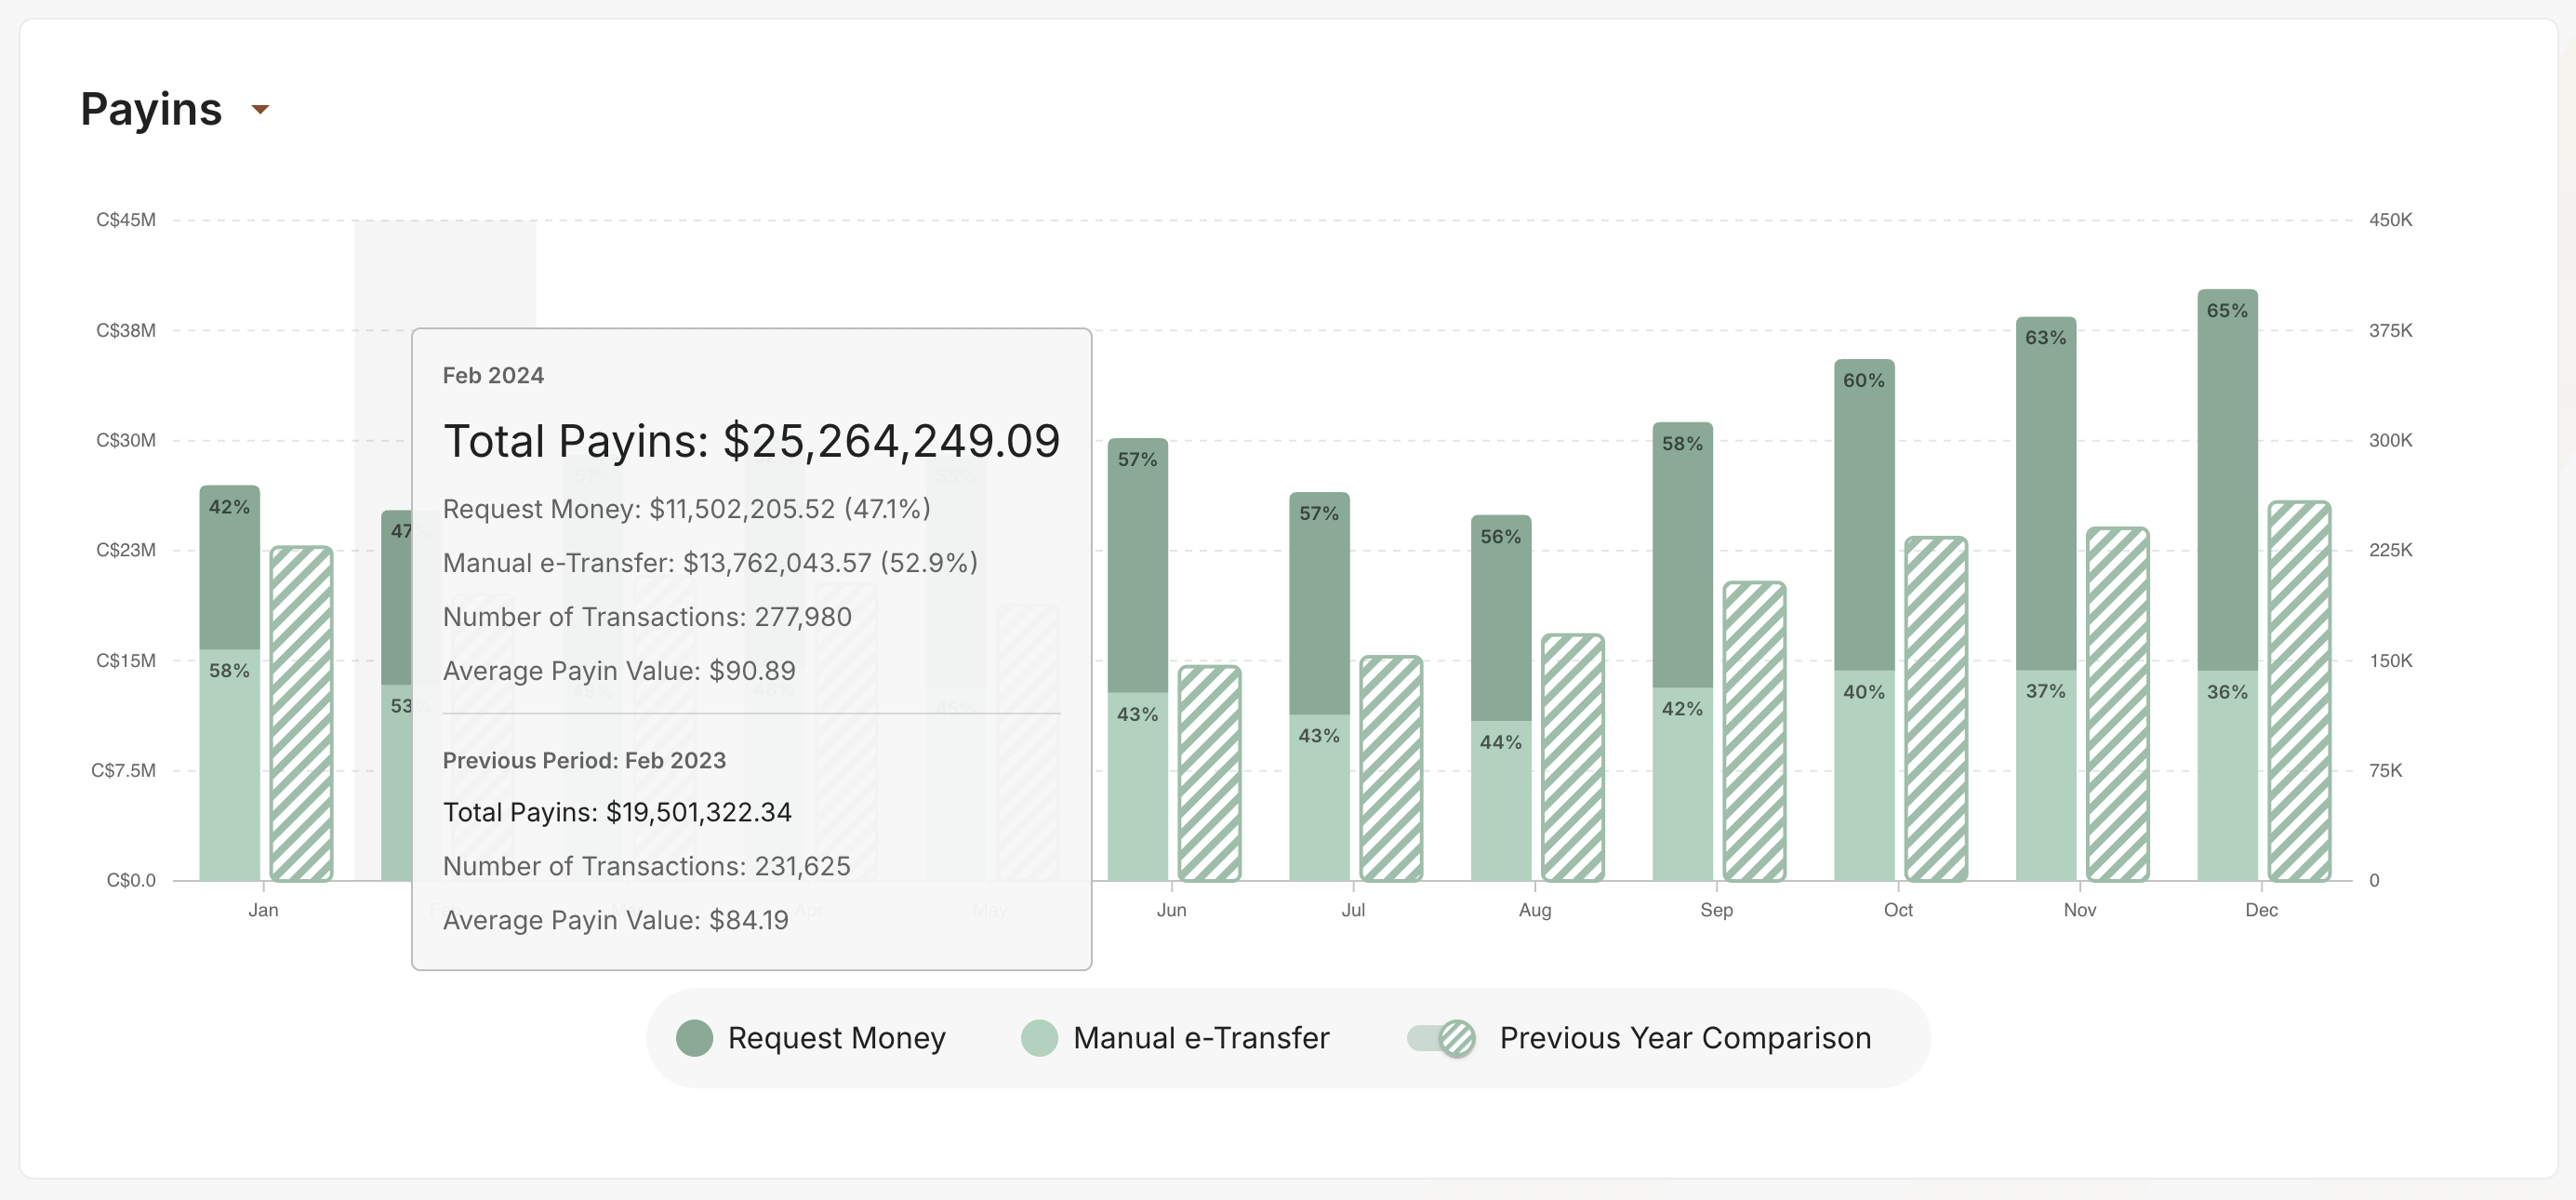
Payins Volume w/ Previous Year Comparison
View Payins Conversion Rates
Payins conversion data, like transaction volumes data, is presented through: 1) summary cards that provide a concise overview and 2) an interactive chart that enables you to explore trends and patterns over time. Merchants can also view competitive benchmarking data to see how they compare to others with similar monthly transaction volumes.
Payins Conversion Summary Cards
The payins conversion summary cards display a merchant's overall gross, first-time, repeat, and 24-hour user conversion rates. These rates are calculated based on your selected Reporting Period and include both Request Money and manual e-Transfer transactions.
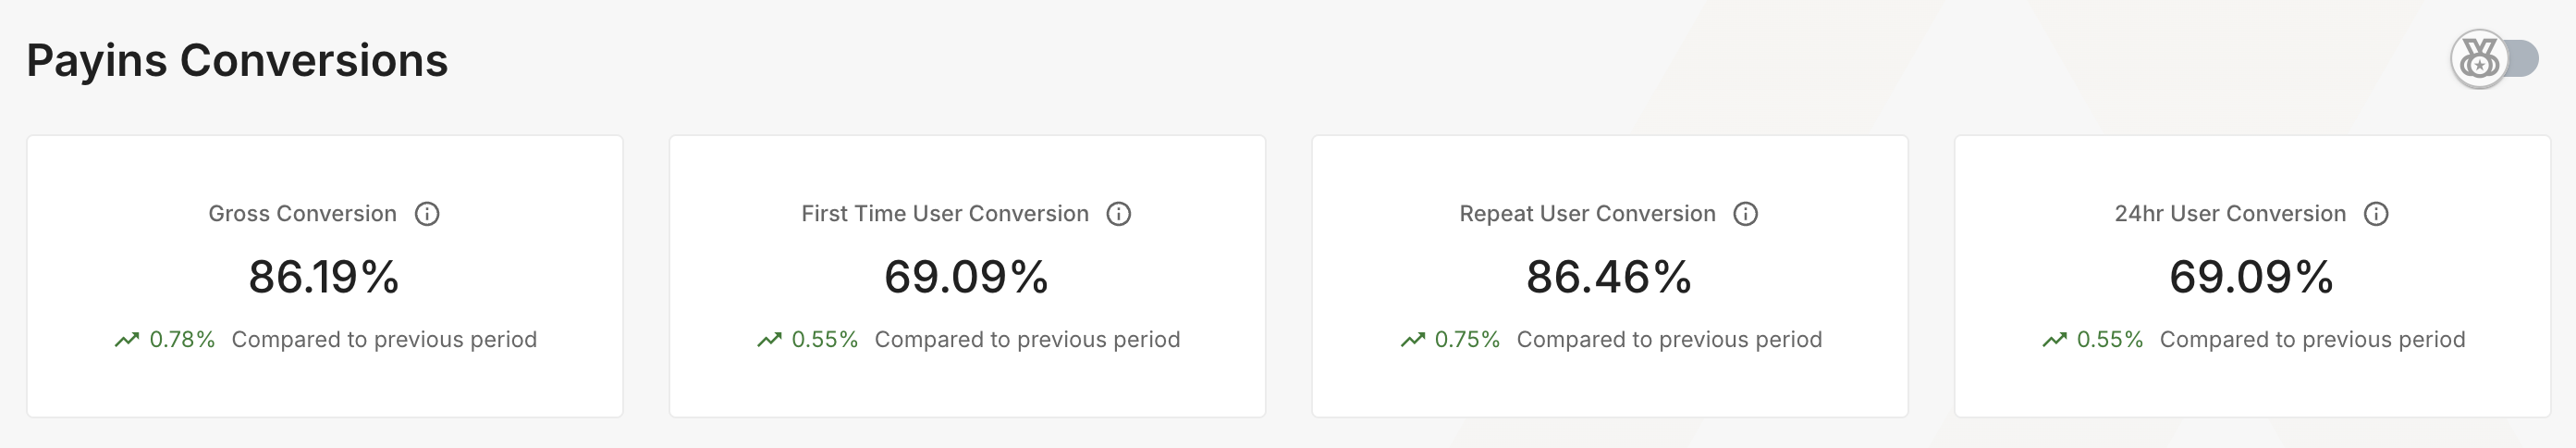
Payins Conversions Summary Cards
For each conversion rate, you can hover over the info icon in the summary card to to view details on how each metric is calculated:
| Conversion Metric | Description | How is it Calculated? |
|---|---|---|
| Gross Conversion Rate | The total percentage of users who have successfully made a deposit over your selected reporting period, regardless of whether they are first-time or repeat users. This metric includes abandons. | [(total number of successful payins by new and existing users) / (total number of successful and rejected payins by new and existing users)] x 100 |
| First Time User Conversion Rate | The percentage of successful deposits made by new users - those who have not previously made a deposit - over your selected reporting period. This metric includes abandons. | [(total number of successful payins by new users) / (total number of successful and rejected payins by new users)] x 100 |
| Repeat User Conversion Rate | The percentage of successful deposits made by repeat users - those who have previously made a deposit - over your selected reporting period. This metric includes abandons. | [(total number of successful payins by existing users) / (total number of successful and rejected payins by existing users)] x 100 |
| 24Hr User Conversion Rate | The percentage of first-time users who make their first deposit within 24 hours of accessing the payment screen, based on your selected reporting period. | [(total first 24hr successful payins by new users) / (total number of first 24hr successful and rejected payins by new users)] x 100 |
These cards also show the % change in rate compared to the previous period.
Based on your selected reporting period, the following outlines the corresponding date range that defines the previous period:
| Reporting Period Selected | Previous Period Date Range |
|---|---|
| Last 7 Days | Previous 7 days |
| Last Week | Previous full week |
| This Month | Previous month, using the same date range For eg, if today is Dec 18th, then the current reporting period would take into account data from Dec 1st - 17th and the comparison would be run against data from Nov 1st - 17th |
| Last Month | Previous full month before last |
| This Quarter | Previous quarter, using the same date range For eg, if today is Dec 18th, then the current reporting period would take into account data from Oct 1st - Dec 17th and the comparison would be run against data from Sept 1st - Nov 17th |
| Last Quarter | Previous full quarter before last |
| Past 6 Months | Previous 6 months before past 6 months, using the same date range For eg. if today is Dec 18th, then the current reporting period would take into account data from Jul 1st - Dec 17th and the comparison would be run against data from Jan 1st - Jun 17th |
| Last Year | Previous full year before last |
| Year to Date | Previous year YTD, using the same date range For eg. if today is Dec 18th, then the current reporting period would take into account data from Jan 1st - Dec 17th 2024 and the comparison would be run against data from Jan 1st - Dec 17th 2023 |
Payins Conversion Chart
The payins conversion chart offers merchants with a clear and visual overview of key conversion metrics over time. It enables you to track conversion rates across different user groups, evaluate the effectiveness of campaigns / promotions and can provide you with insights into your cashier experience. Merchants can toggle conversion rates on / off for a comparative view or focus solely on a specific metric.
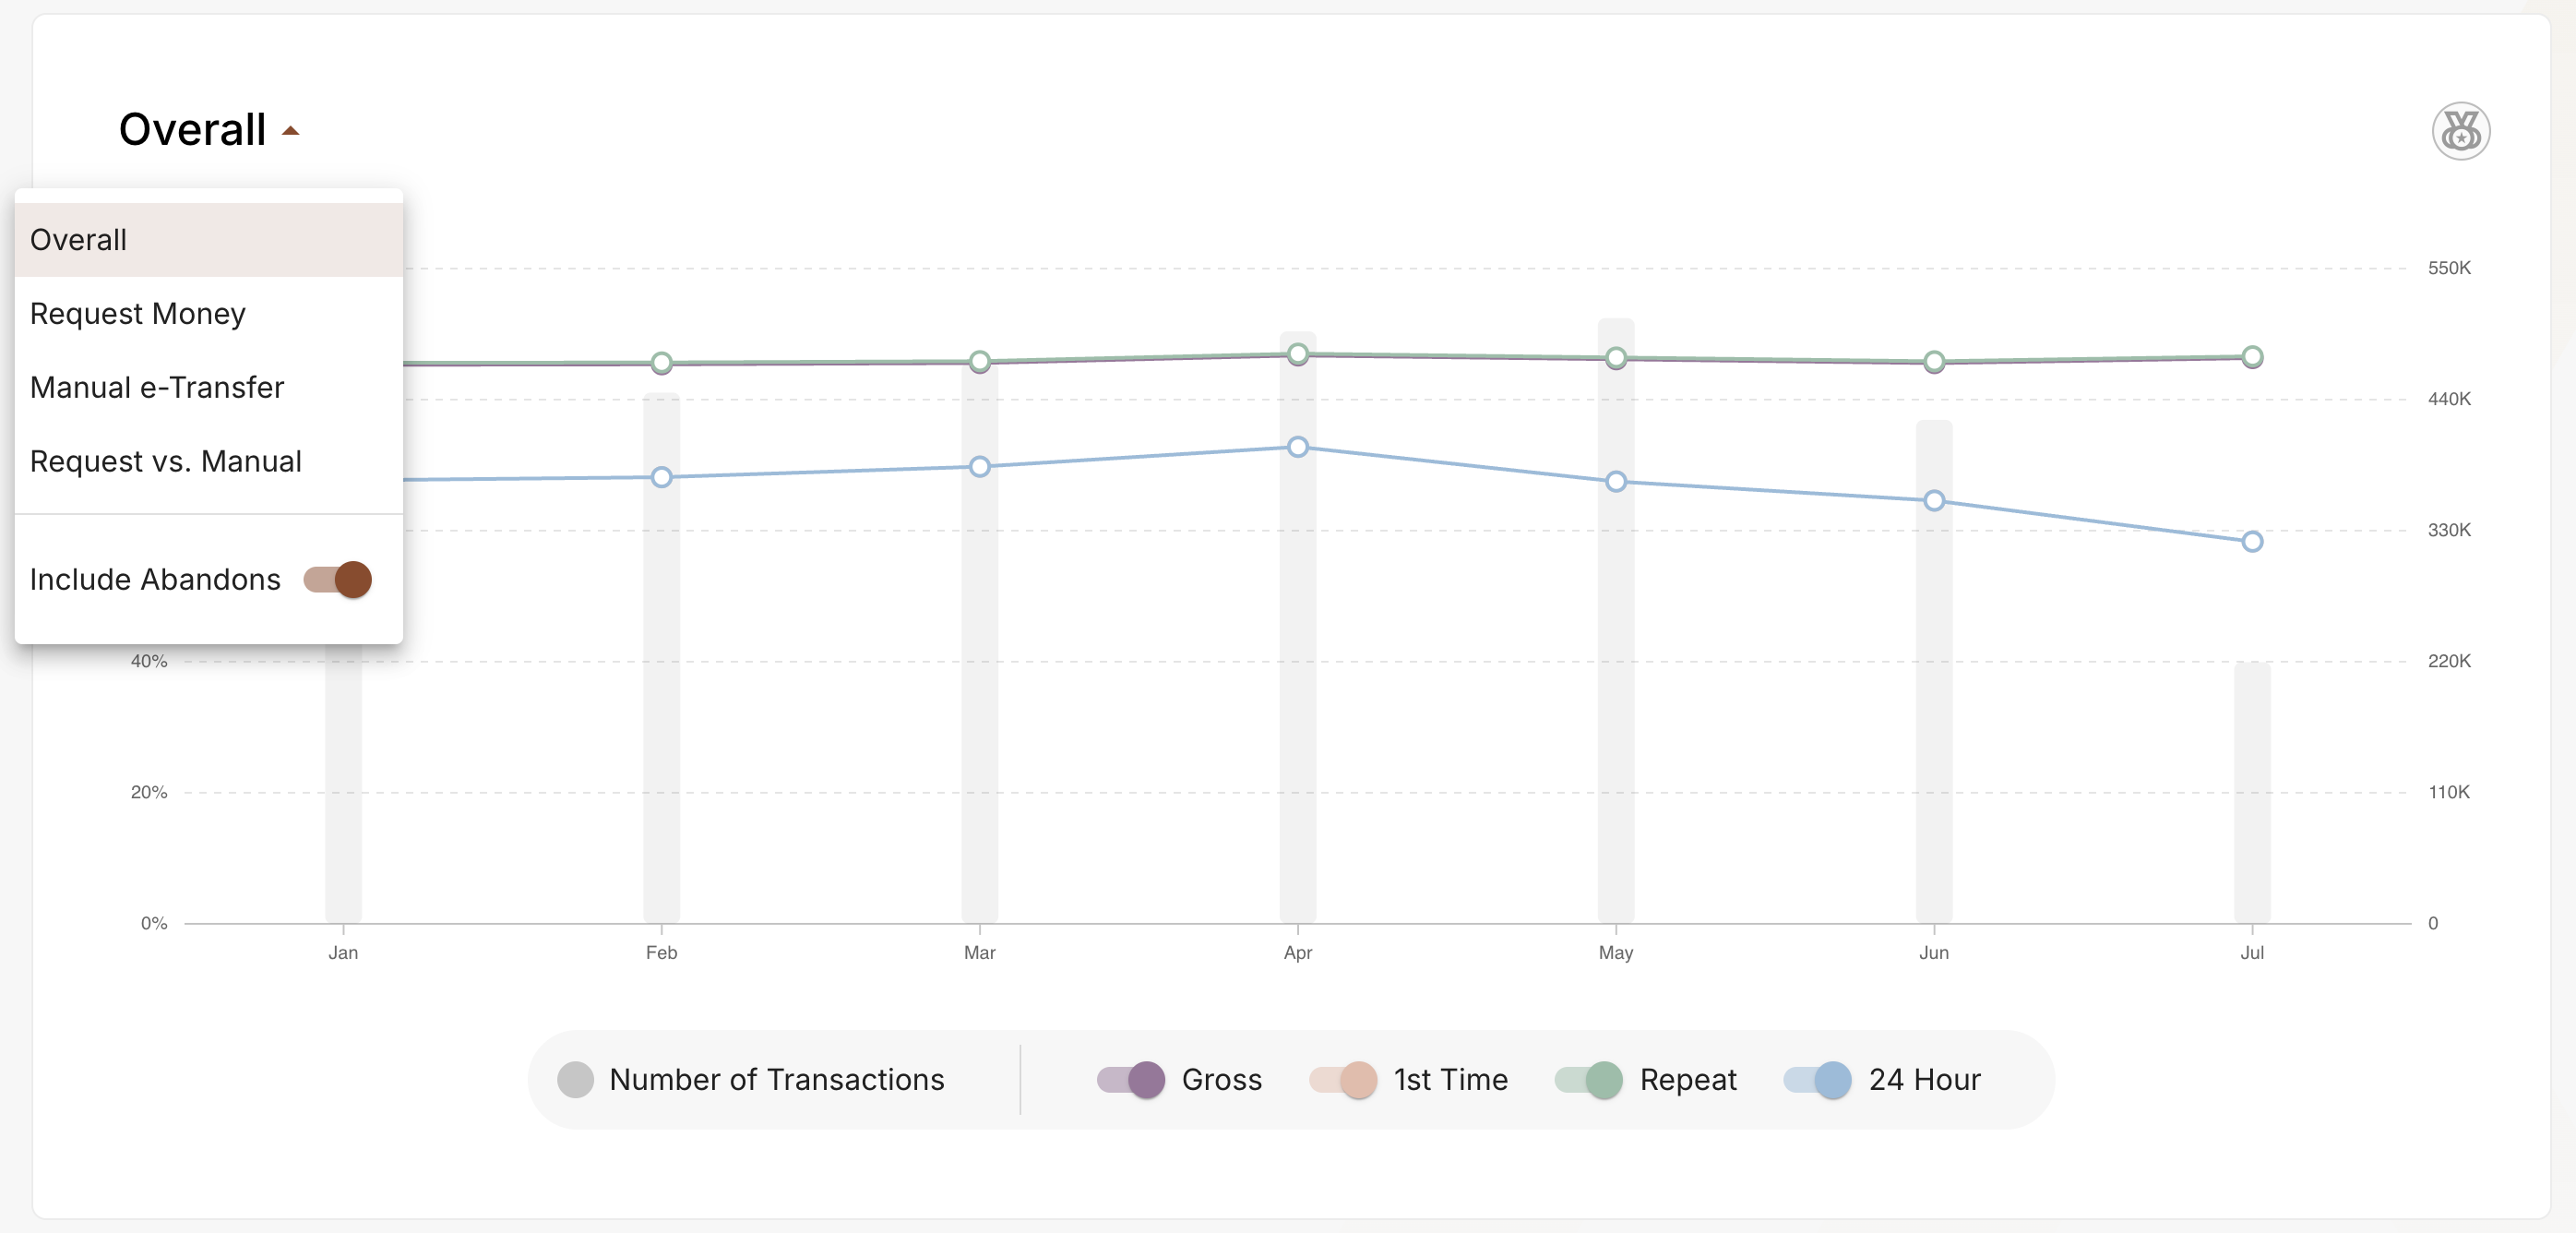
Payins Conversion Chart
Users can view conversion rates for the following payin options:
| Payment Option | Definition |
|---|---|
| Overall | This option includes both Request Money and Manual e-Transfer deposit transactions in the calculation of each payins conversion metric. |
| Request Money | This option includes only Request Money deposit transactions in the calculation of each payins conversion metric. |
| Manual e-Transfer | This option includes only manual e-Transfer deposit transactions in the calculation of each payins conversion metric. |
| Request Money vs. Manual e-Transfer | This option allows users to compare the performance of their Request Money payin conversion rates against their Manual e-Transfer payin conversion rates |
You can also hover over a specific time period to zoom in on conversion and transaction details.
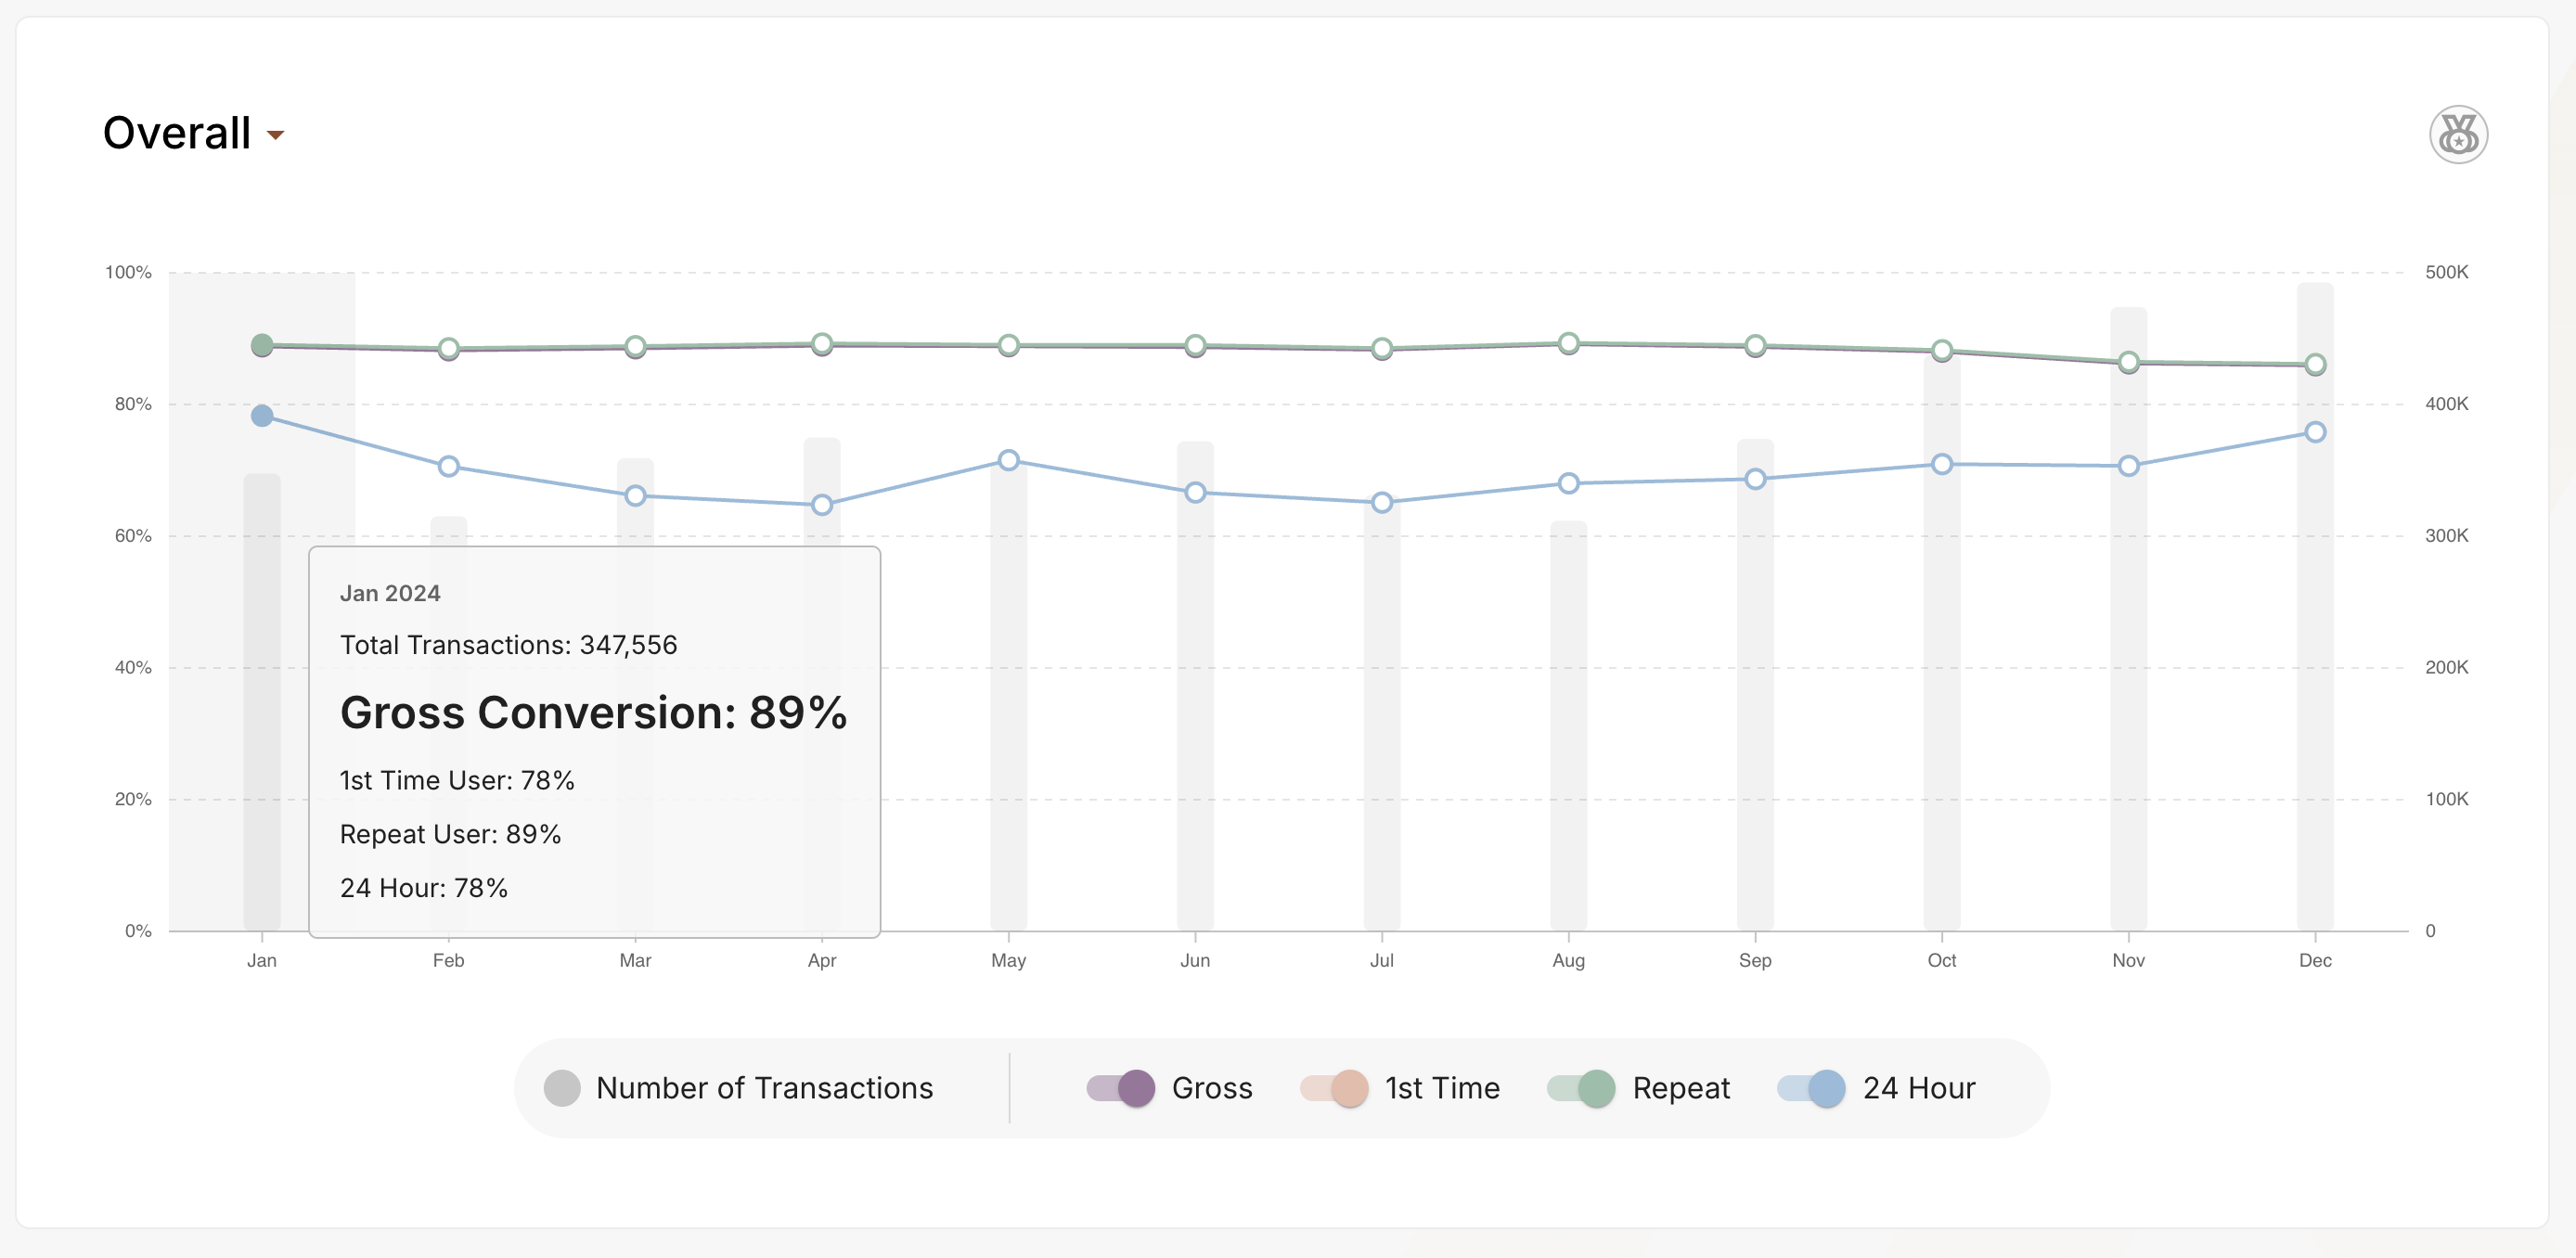
Payins Conversion Detailed View
View Competitive Benchmarking Data for Payins Conversion Rates
We've introduced a new Competitive Benchmarking feature that gives merchants valuable insight into how their conversion performance compares to similar merchants. Based on anonymized, aggregated data from merchants with similar average monthly transaction volumes, this feature shows 25th, 50th, and 75th percentile benchmarks for four key conversion metrics:
- Gross conversion rate
- First time user conversion rate
- Repeat user conversion rate
- 24hr user conversion rate
Merchants will be able to see where they stand relative to similar competitors, helping them identify opportunities for growth and improvement.
Competitive Benchmarking Data
Enable the Competitive Benchmarking Toggle
To enable the feature, locate the "competitive benchmarking" toggle and slide the switch to the "on" position.
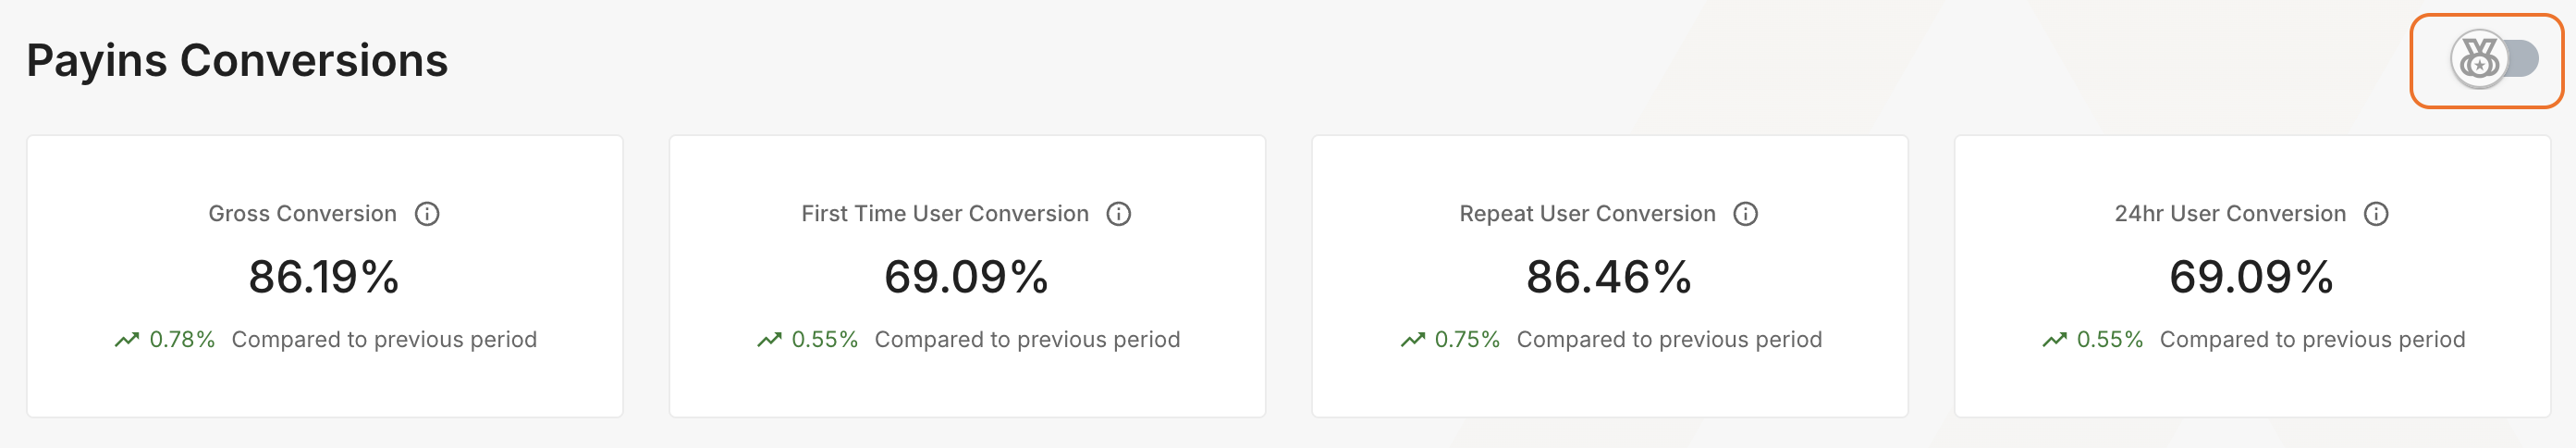
Competitive Benchmarking Toggle
See Your Relative Conversion Performance at a Glance
When the Competitive Benchmarking feature is enabled, the payins conversion summary cards display an alternative view of your conversion metrics for the selected reporting period, alongside anonymized benchmarks (25th, 50th, and 75th percentiles) based on aggregated data from similar merchants.
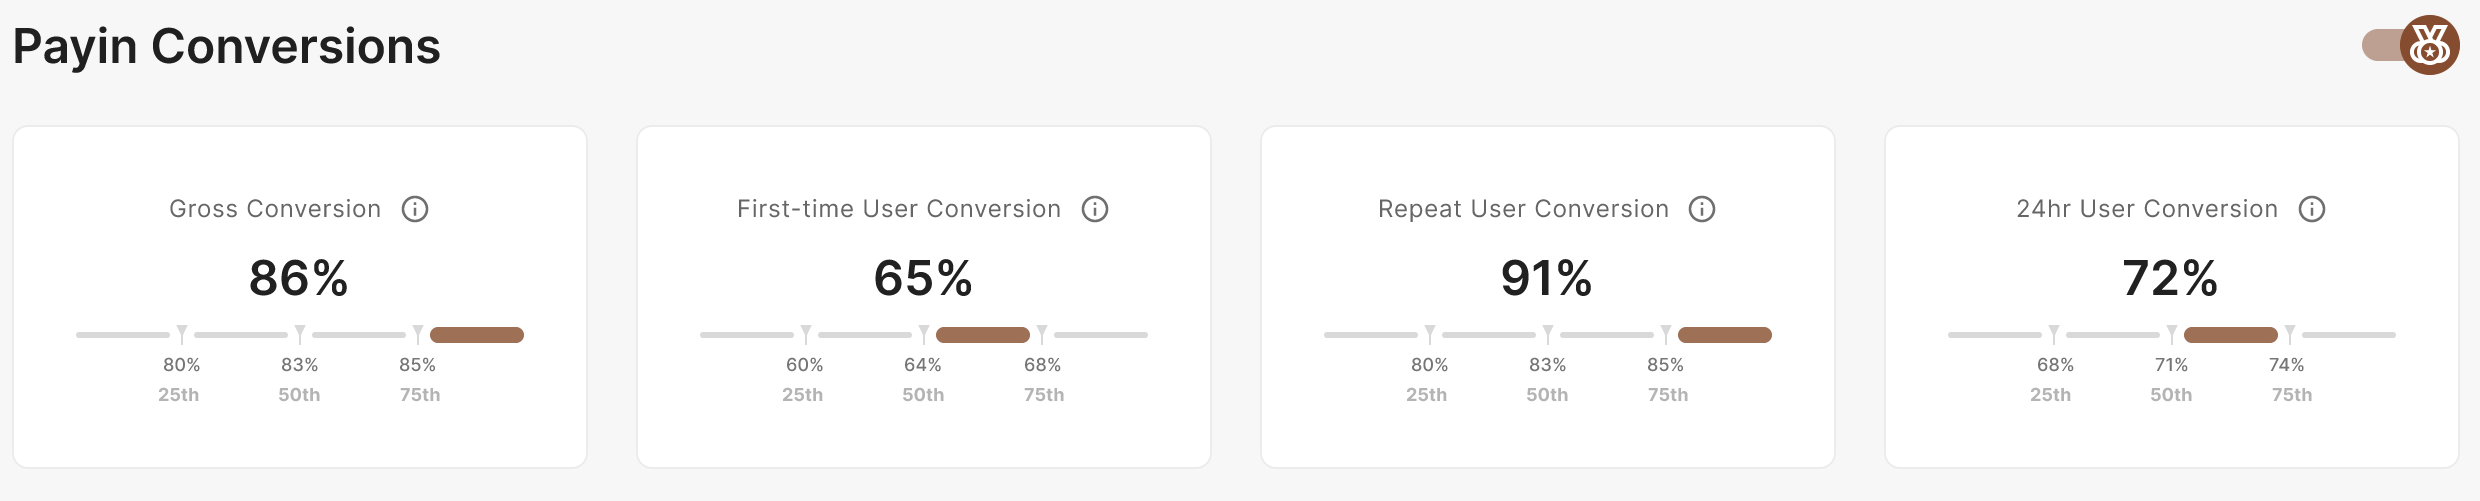
Payins Conversion Summary Cards w/ Competitive Benchmarking Enabled
At a quick glance, this information allows merchants to see whether their key conversion metrics indicate a strong overall performance relative to competitors or if there might be some room for improvement.
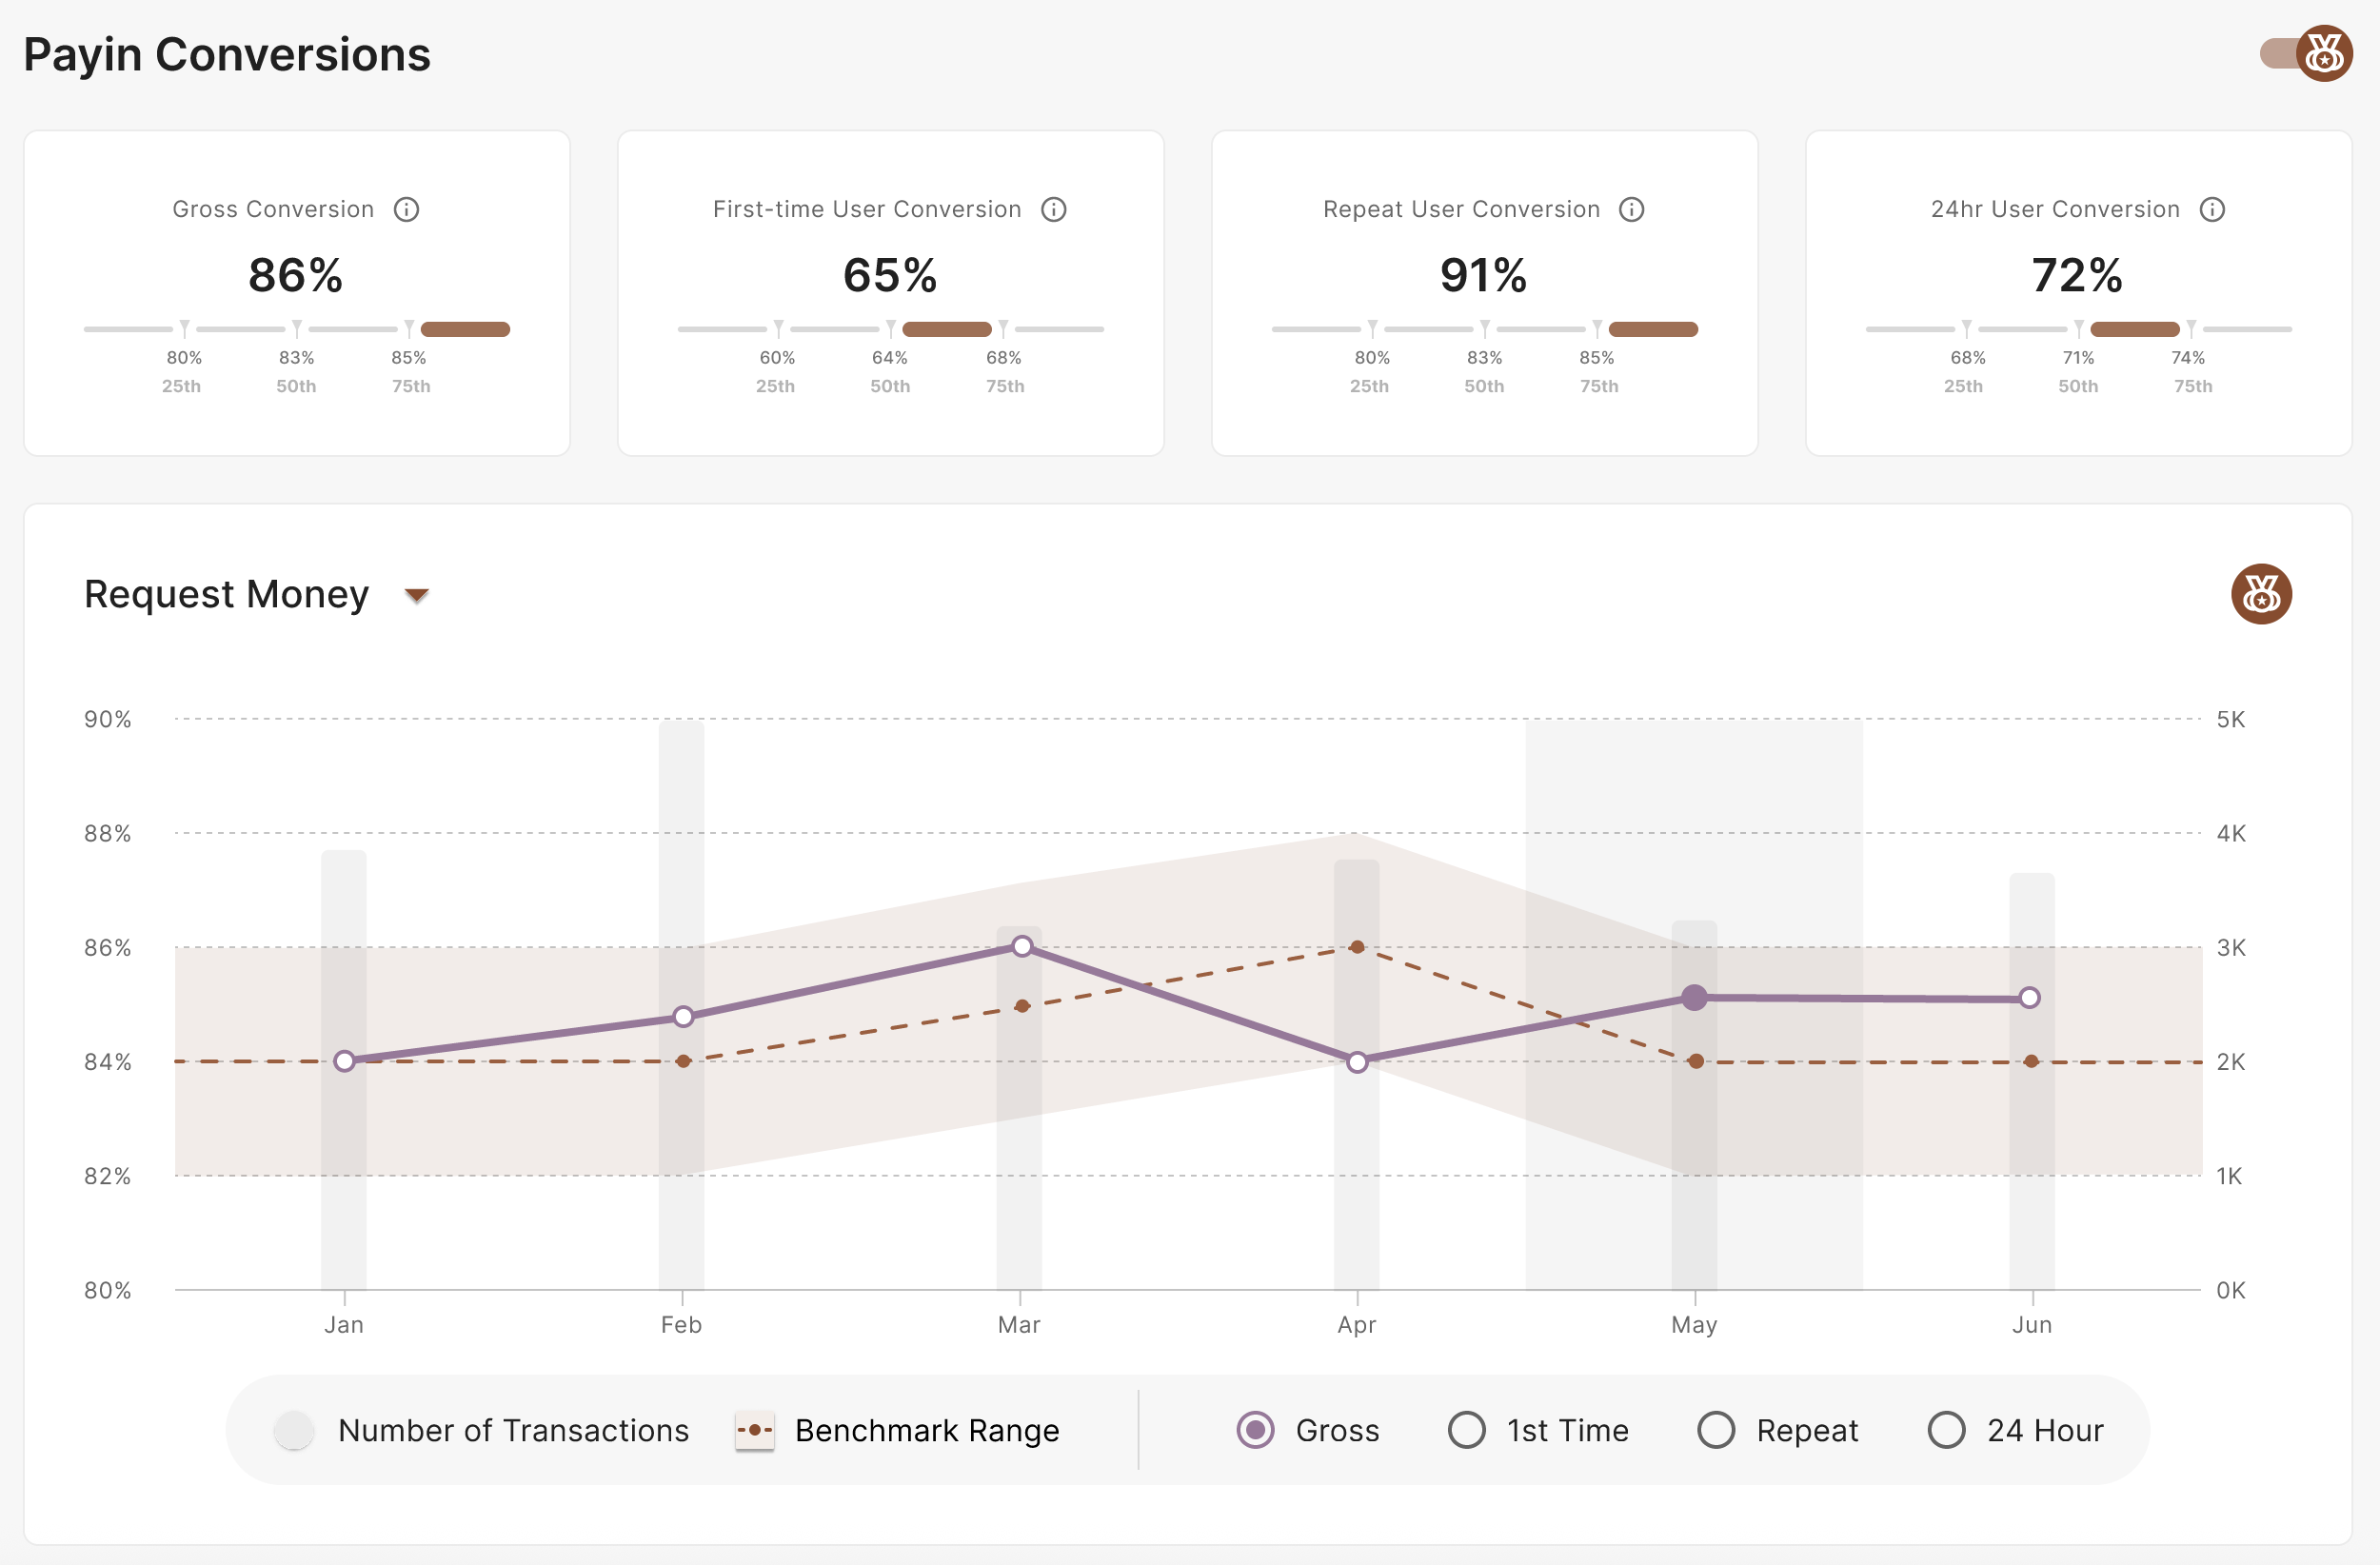
Visualize Your Key Conversion Metrics Against Competitive Benchmarks
The conversion benchmarking chart allows merchants to dive deeper into how their conversion metrics stack up over time against similar merchants by visualizing their performance alongside competitive benchmarking data. For each metric - gross conversion, first time user conversion, repeat user conversion and 24hr user conversion, the chart displays:
- Your Conversion Rate (straight purple line): Highlighted on the chart so you can easily see where you stand
- Competitive Benchmarking Range (brown shaded area w/ dotted line): The 25th, 50th (median), and 75th percentile values based on anonymized, aggregated data from similar merchants in your category
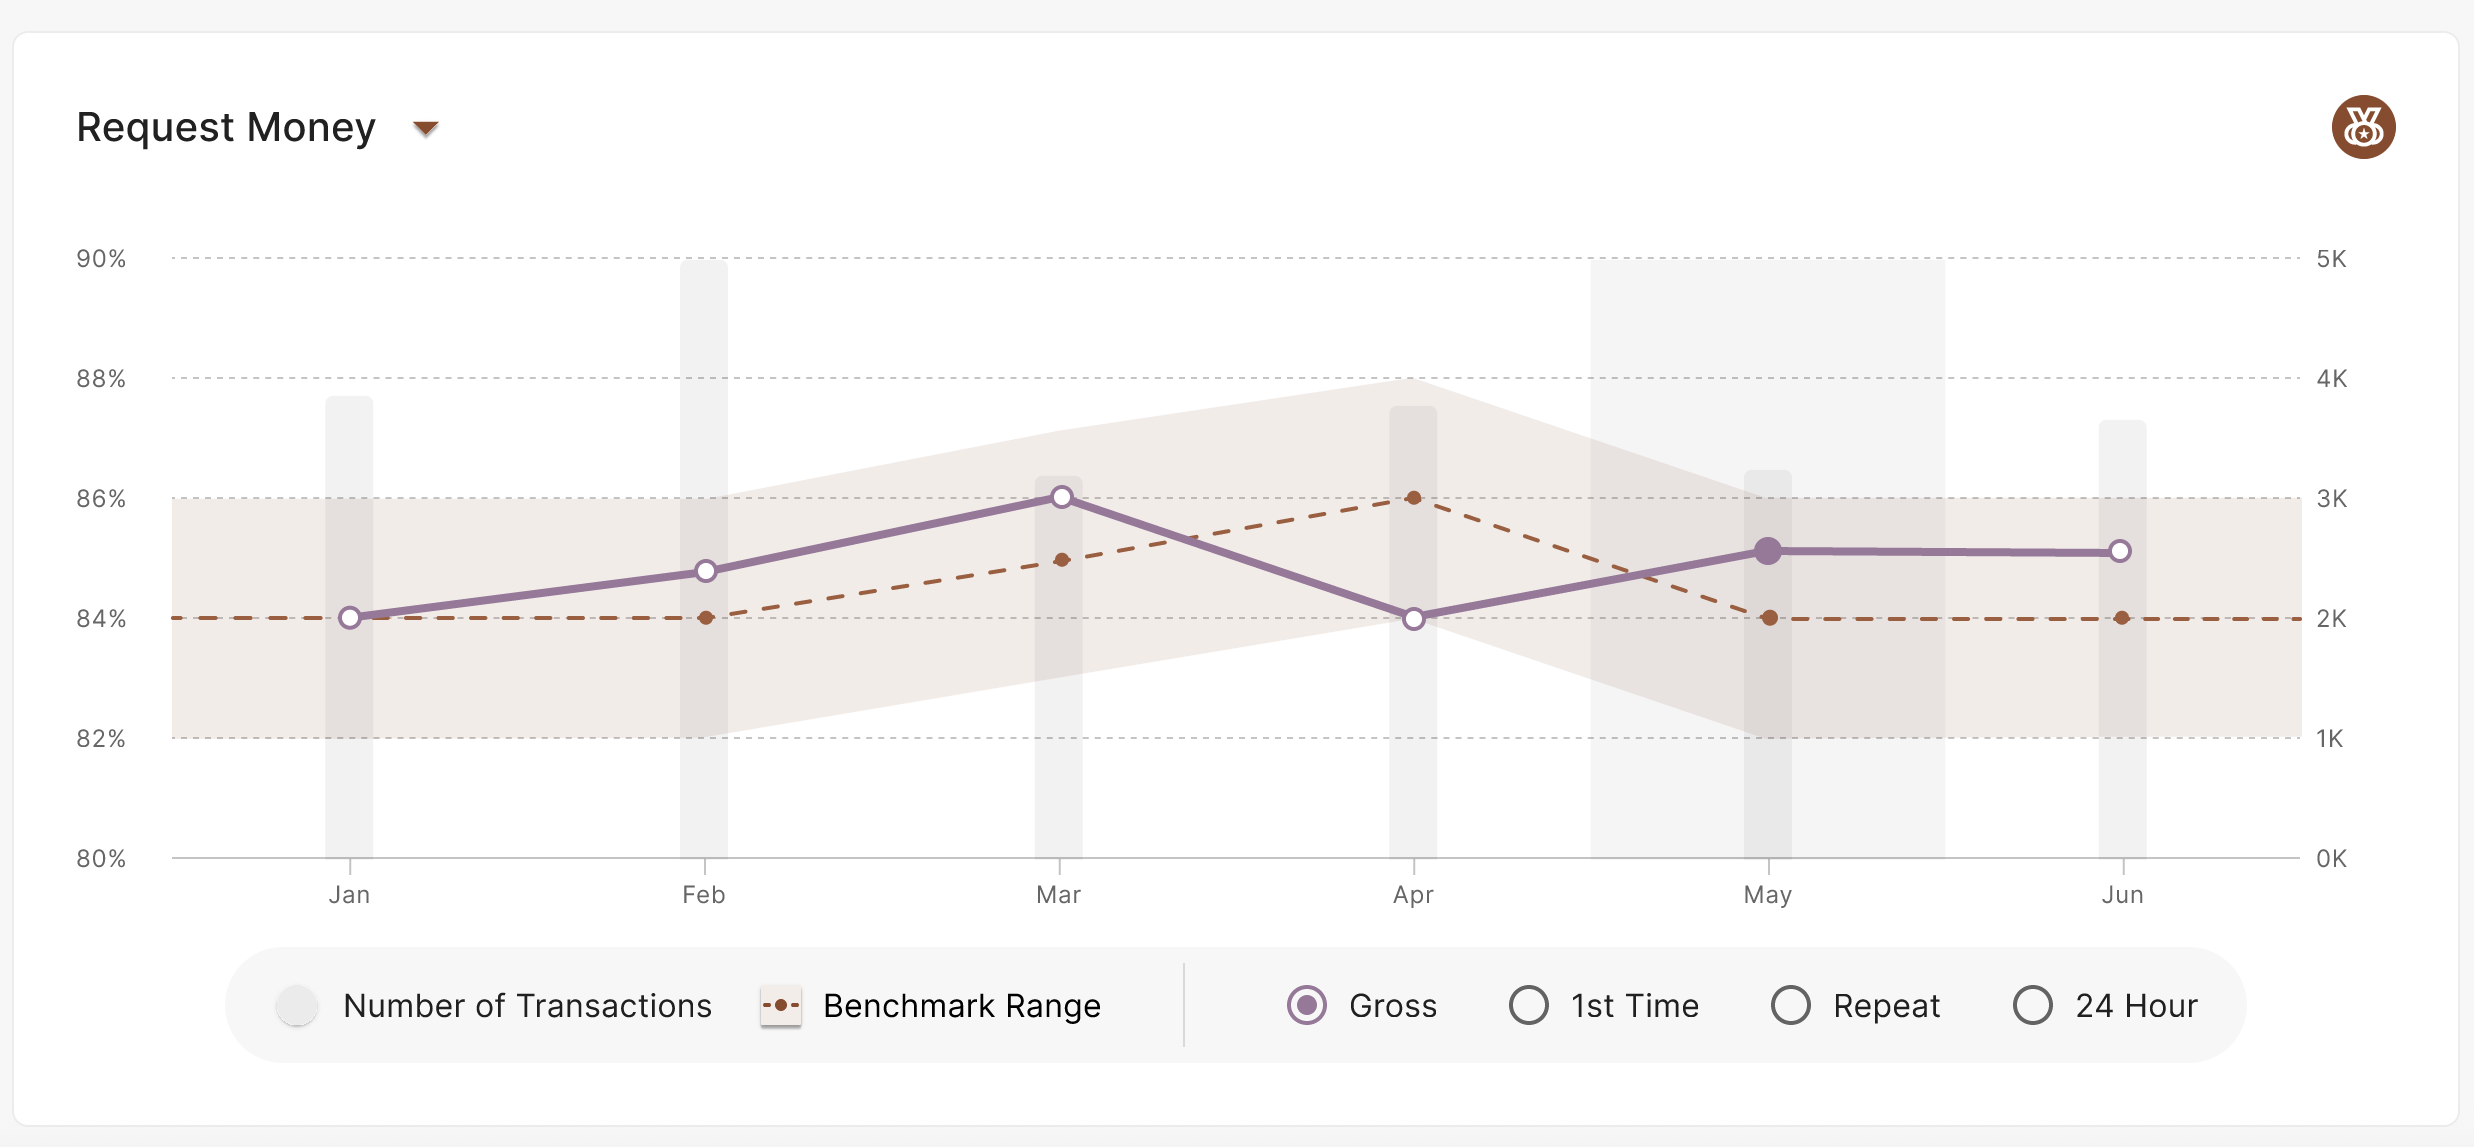
Payins Conversion Chart w/ Competitive Benchmarking Enabled
Users can view conversion rates with competitive benchmarking for the following payin options:
| Payment Option | Definition |
|---|---|
| Overall | This option includes both Request Money and Manual e-Transfer deposit transactions in the calculation of each payins conversion metric. |
| Request Money | This option includes only Request Money deposit transactions in the calculation of each payins conversion metric. |
| Manual e-Transfer | This option includes only manual e-Transfer deposit transactions in the calculation of each payins conversion metric. |
View Payins Approval Metrics
We've introduced two new charts designed to provide merchants with an overview of the success and failure rates of their consumer payins based on a selected reporting period.
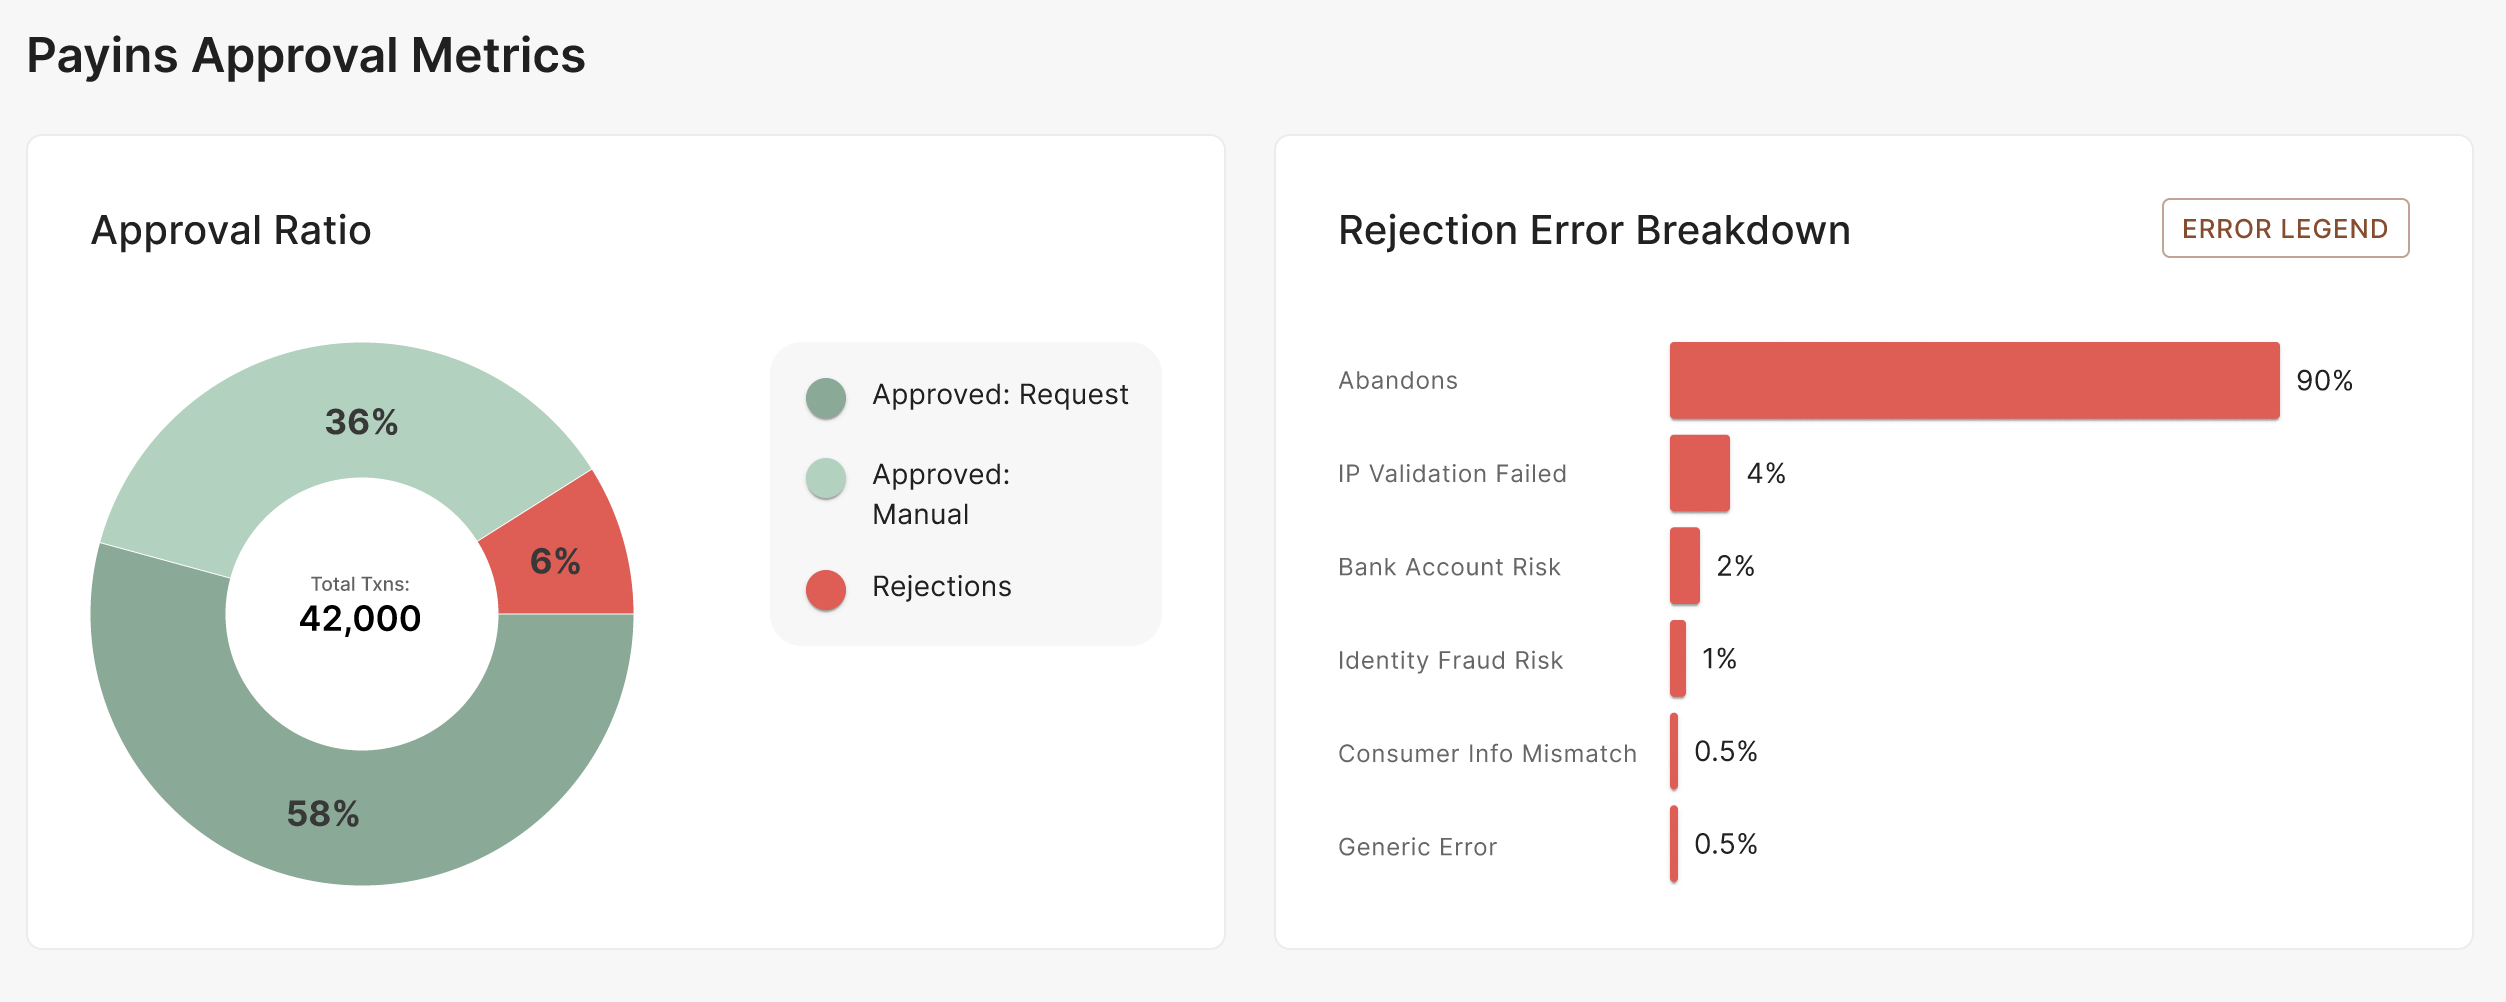
Payins Approval Metrics
Approval Ratio Chart
This dynamic chart visualizes your overall approval rate of all payin transactions during a selected reporting period, highlighting which payment options are more successful and preferred by your consumers. It also shows the proportion of failed or rejected transactions, with the aim of helping you monitor the performance of your deposit flows and identify potential revenue loss.
- Total Transactions: The center of the donut chart indicates the total number of successful and unsuccessful payin transactions that occurred during a selected reporting period and represents the base for all percentages shown
- Approved: Request Money: The darker green section indicates the total percentage of successful payin transactions using Request Money
- Approved: Manual e-Transfer: The lighter green section indicates the total percentage of successful payin transactions using manual e-Transfer
- Rejections: The red section indicates the total percentage of unsuccessful payin transactions
Rejection Error Breakdown Chart
Given a selected reporting period, this chart breaks down the most common errors contributing to the rejection rate shown in the Approval Ratio Chart, helping merchants understand the key issues causing unsuccessful payin transactions.
Frequently Asked Questions (FAQs)
For additional information not covered in this guide, you can visit the Homepage and Analytics Dashboard FAQs page.